Guiding Principles
Human behaviour is fascinating. It is a noble pursuit to try gain a better understanding of things such as how we make decisions, the systems in which we make decisions, how we influence each other and how our individual choices translate into aggregate outcomes. In doing so, we gain new perspectives on a broad range of topics such as education, migration, health, labor and policy. As a guiding principle, I believe in having an open mind when exploring and a cautious mind when exploiting.
I’ll update this page sporadically and not on a specific schedule. It’s meant to be light and fun for both me and you. It’s highly unconventional to write in a stream of thought manner like this. But heck, why not? For just this part of the website, enjoy some hot mess.
Here’s what this page contains right now:
- Seminar Participation
- Exploring the Lex Fridman Podcast
- Exploring the Stata Journal
- Exploring my Netflix
- Exploring my library
- Exploring ASSA 2024
- Exploring my car expenses
- Exploring my instagram
1 Seminar Participation
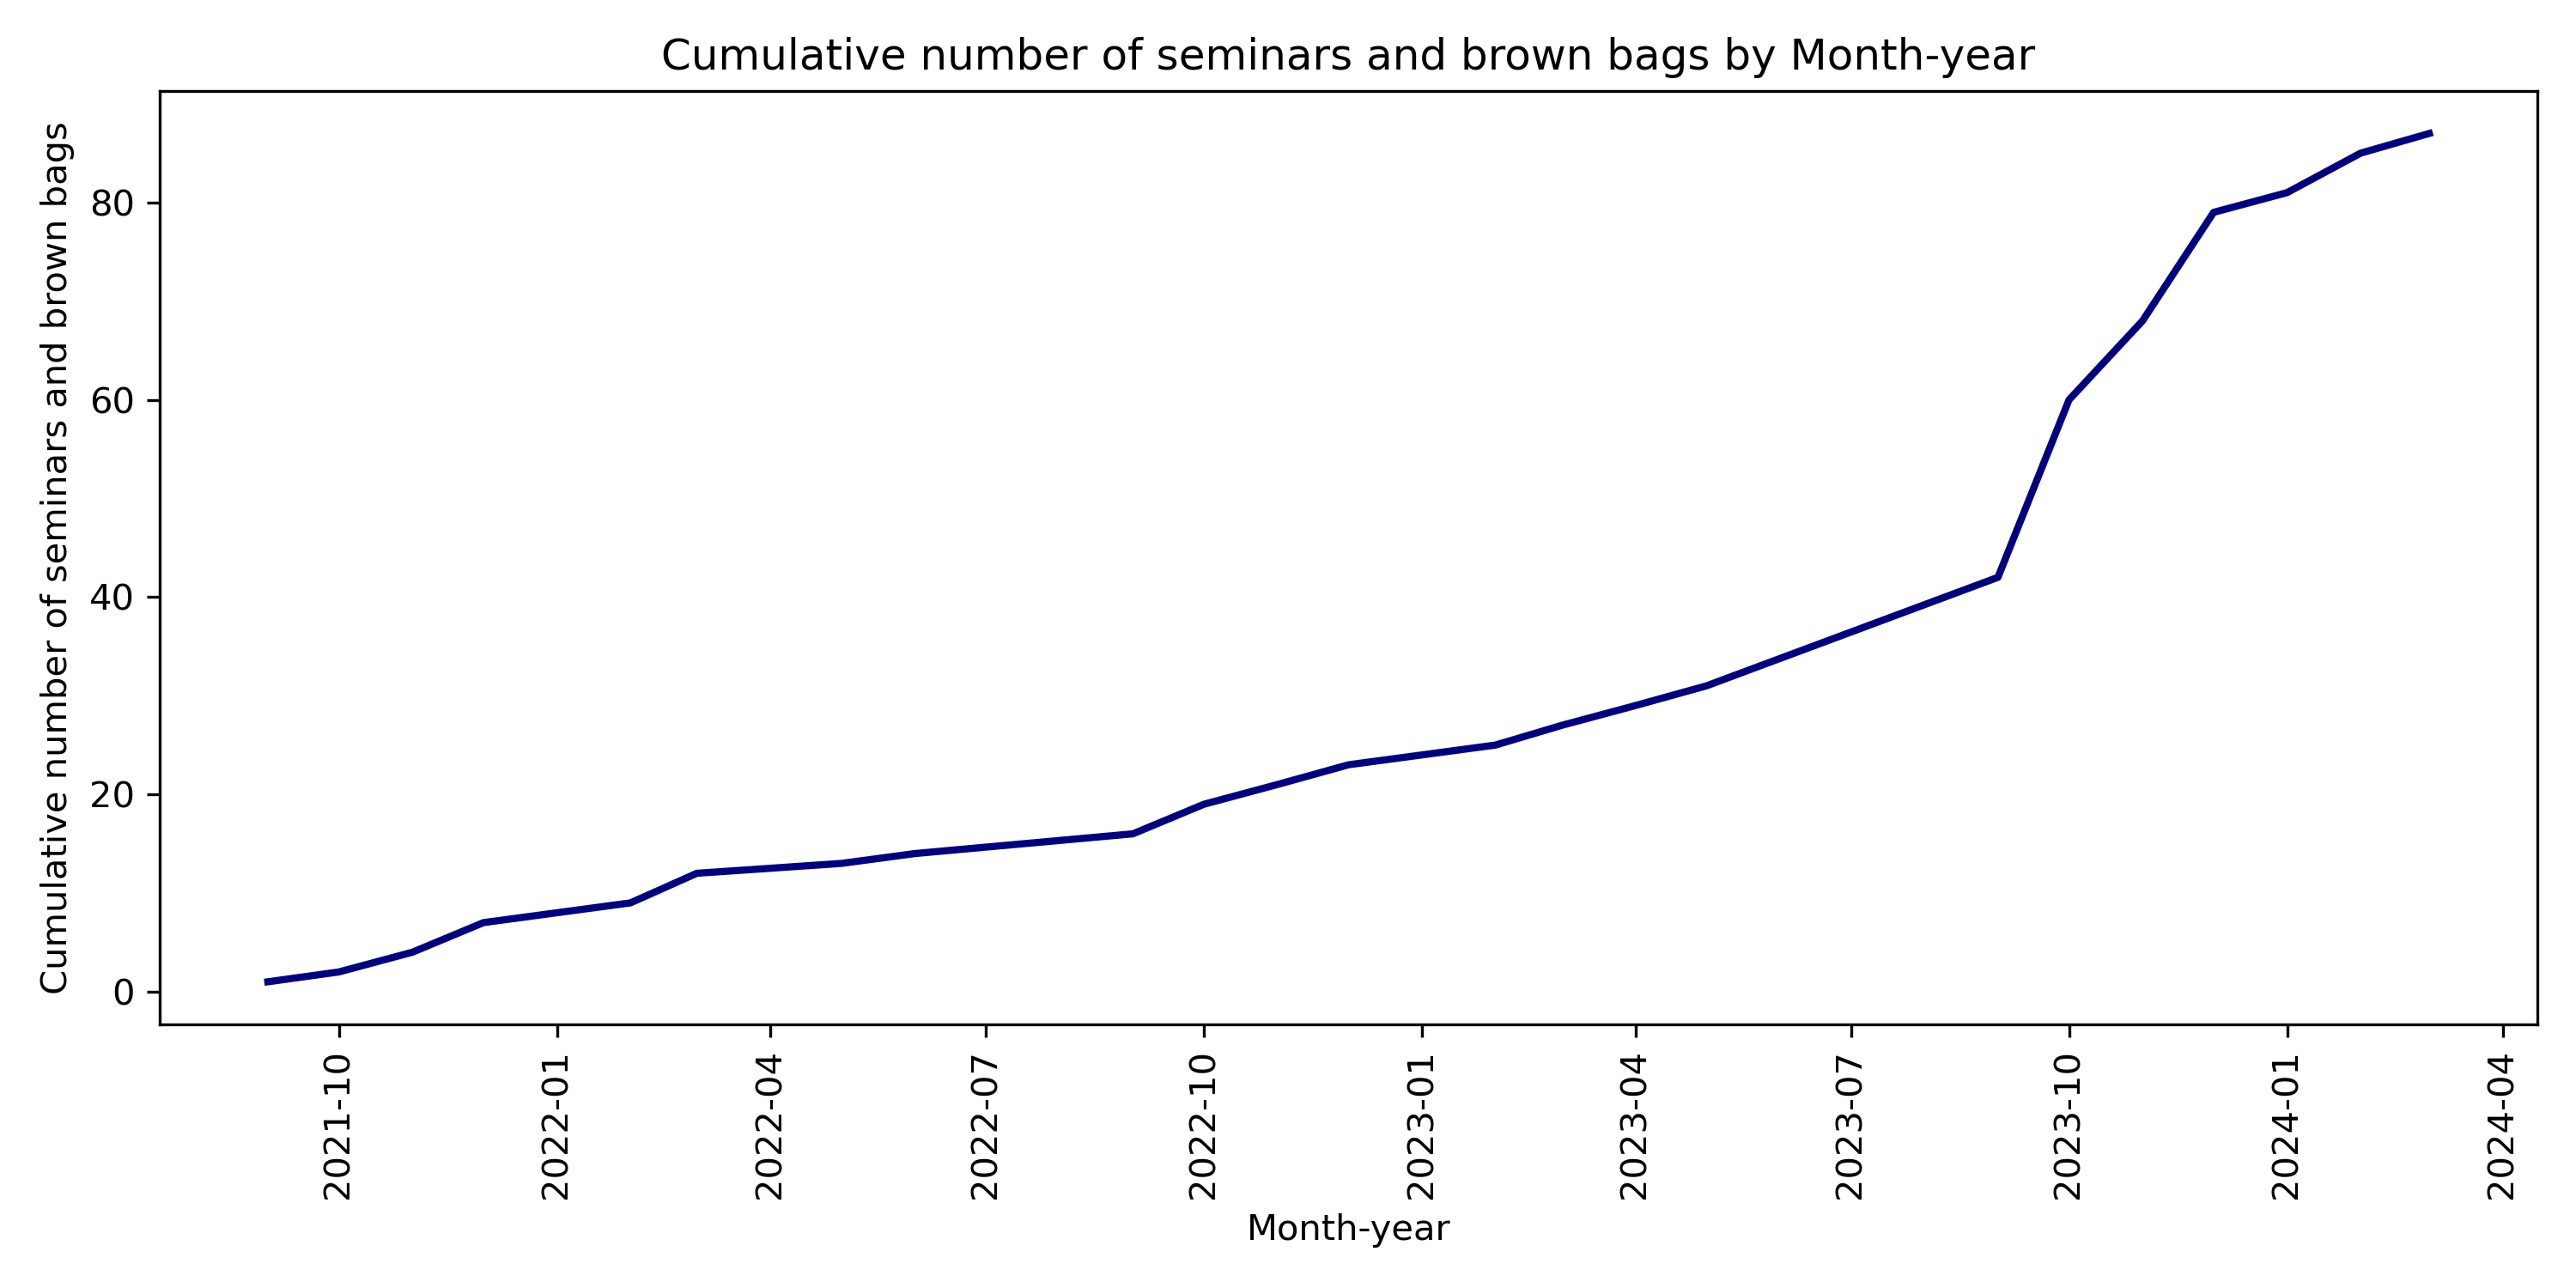
Have you ever wondered exactly how many presentations I have attended since starting my PhD? I sure have. And I’ve done something about it.
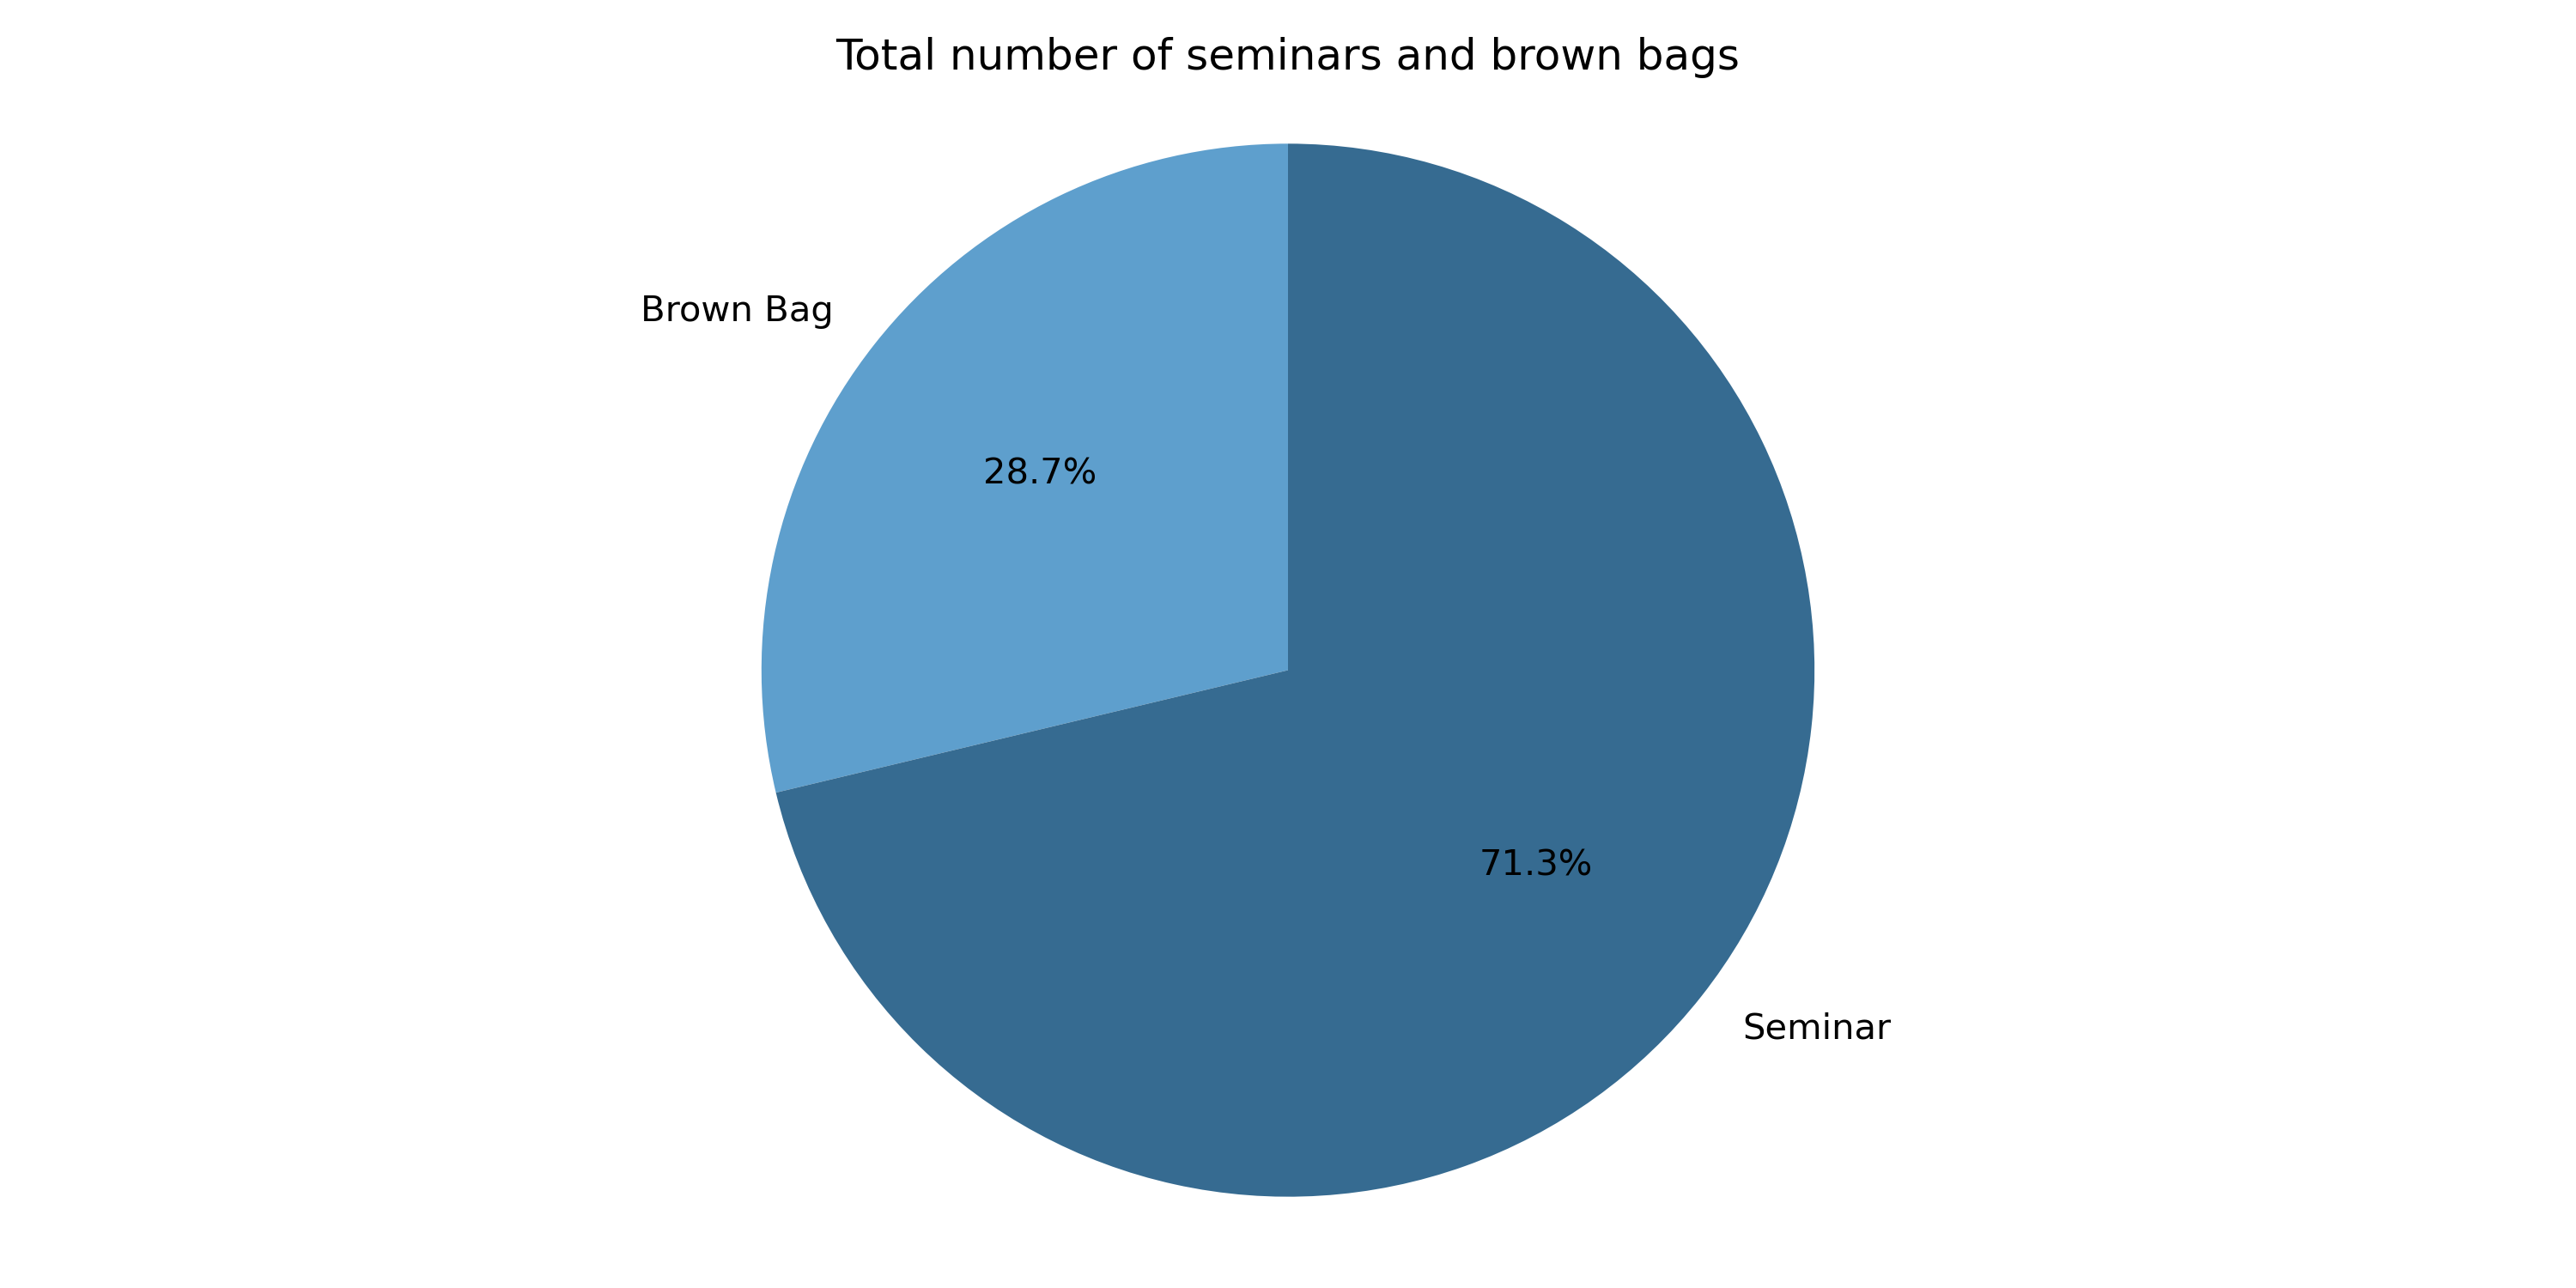
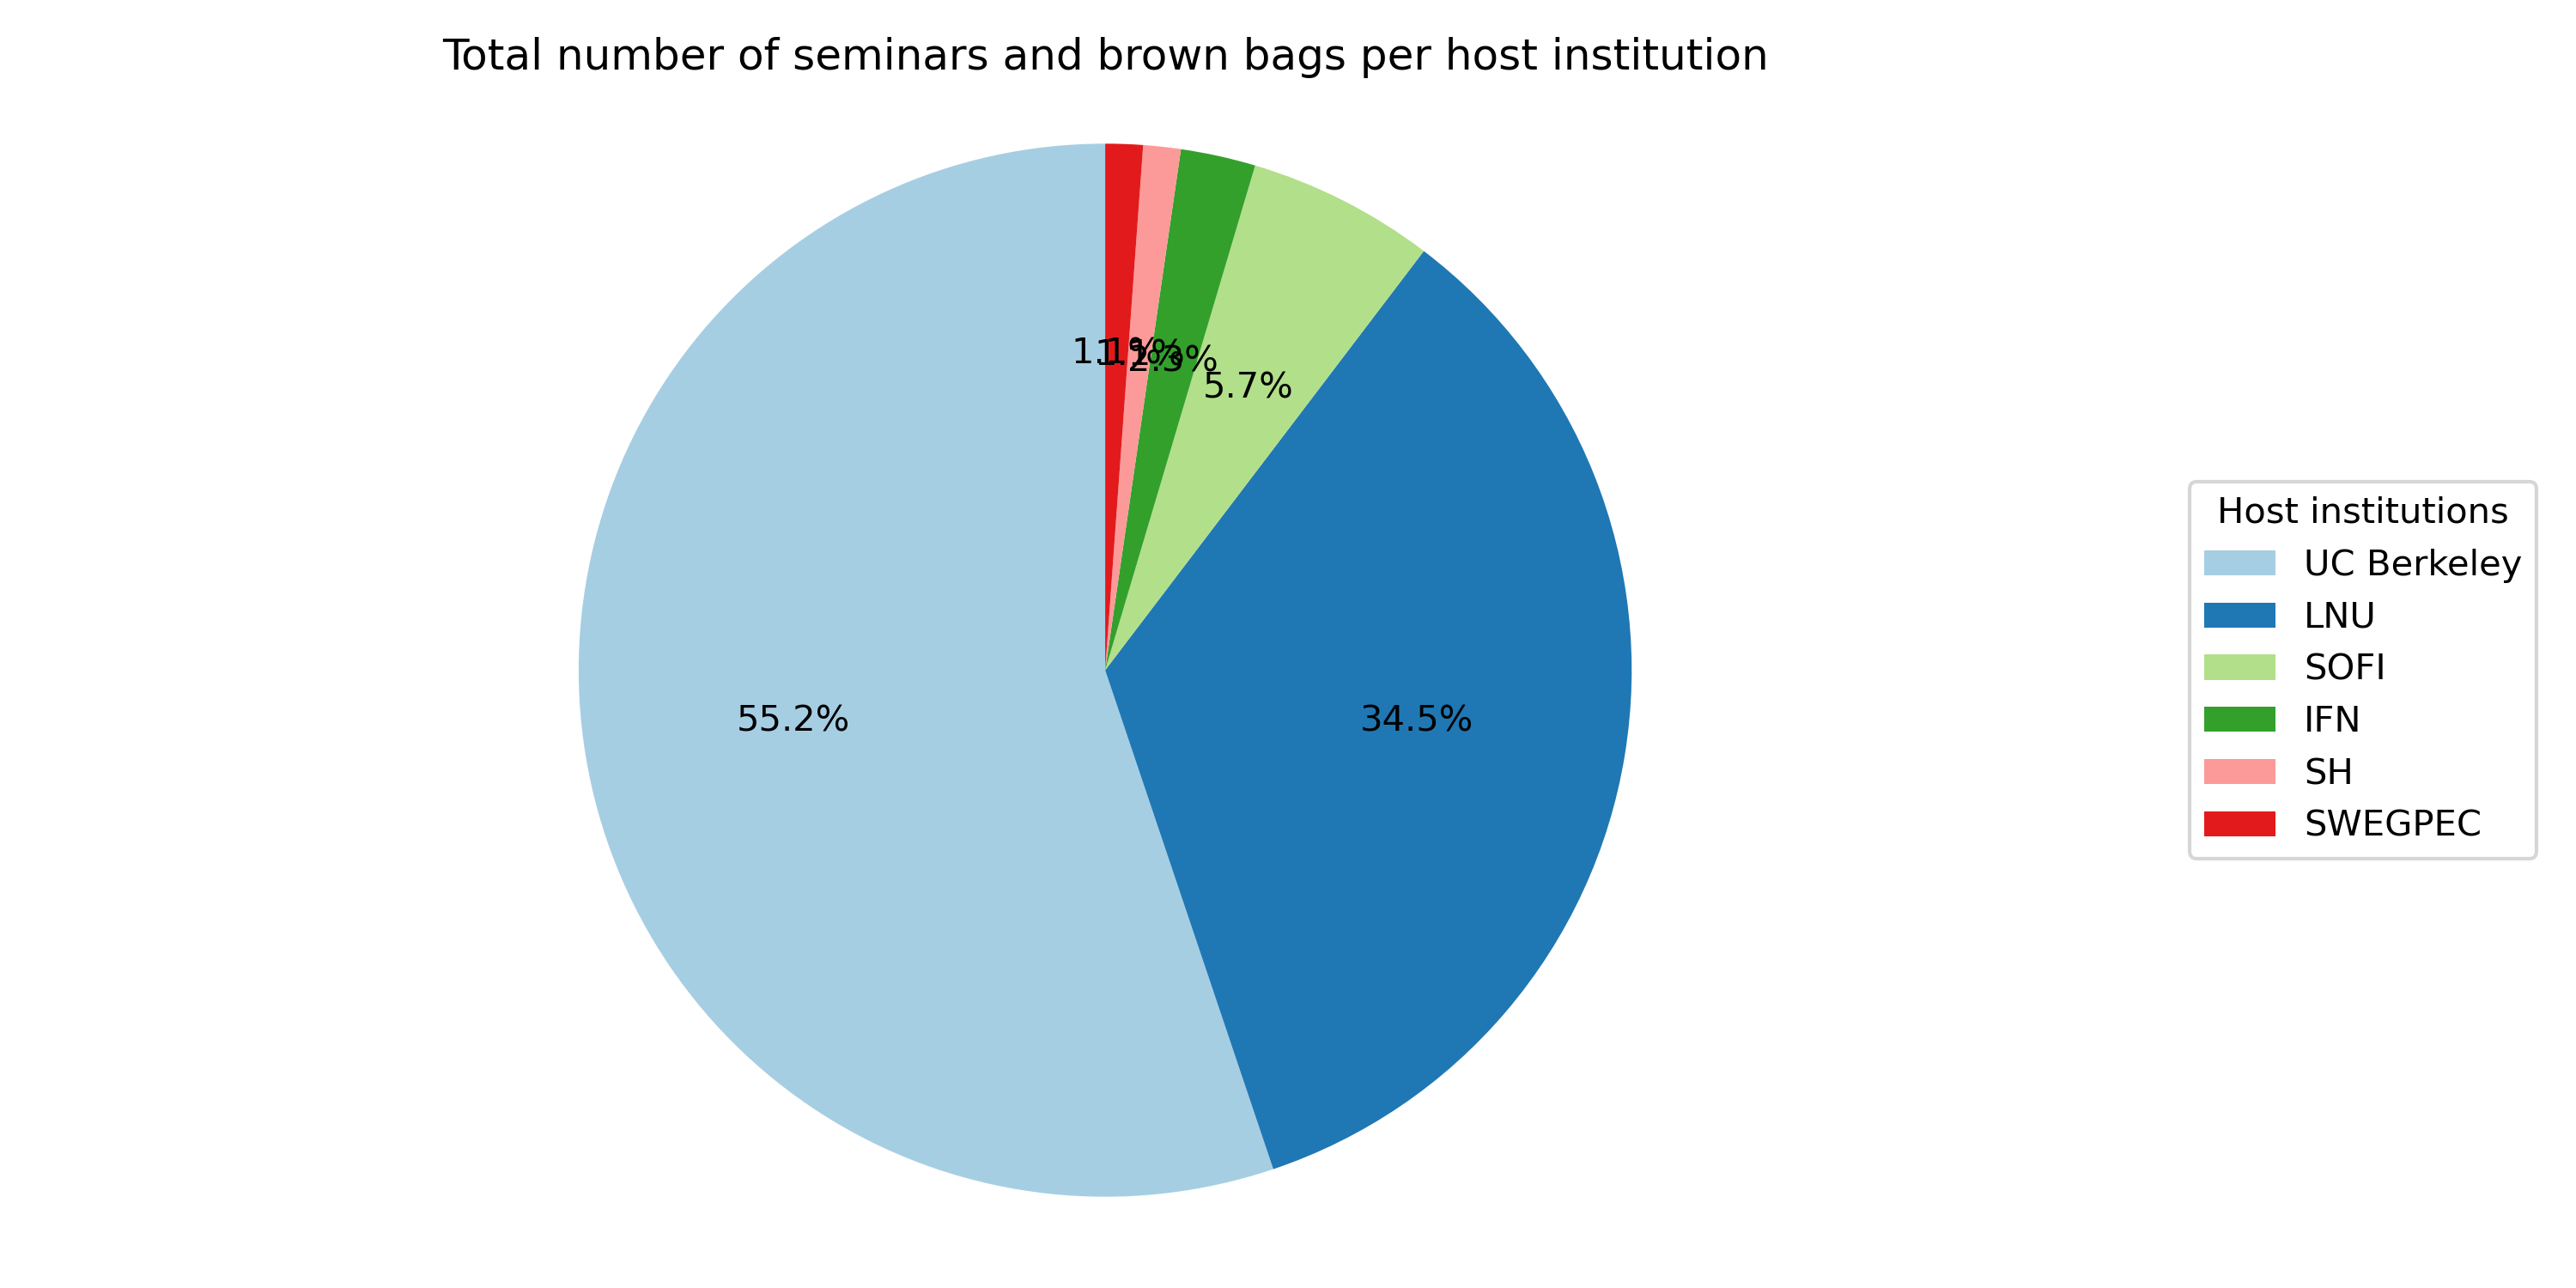
Here are some plots for the seminars and brown bags that I have attended.
In the figure below, can you spot when my exchange semester began?
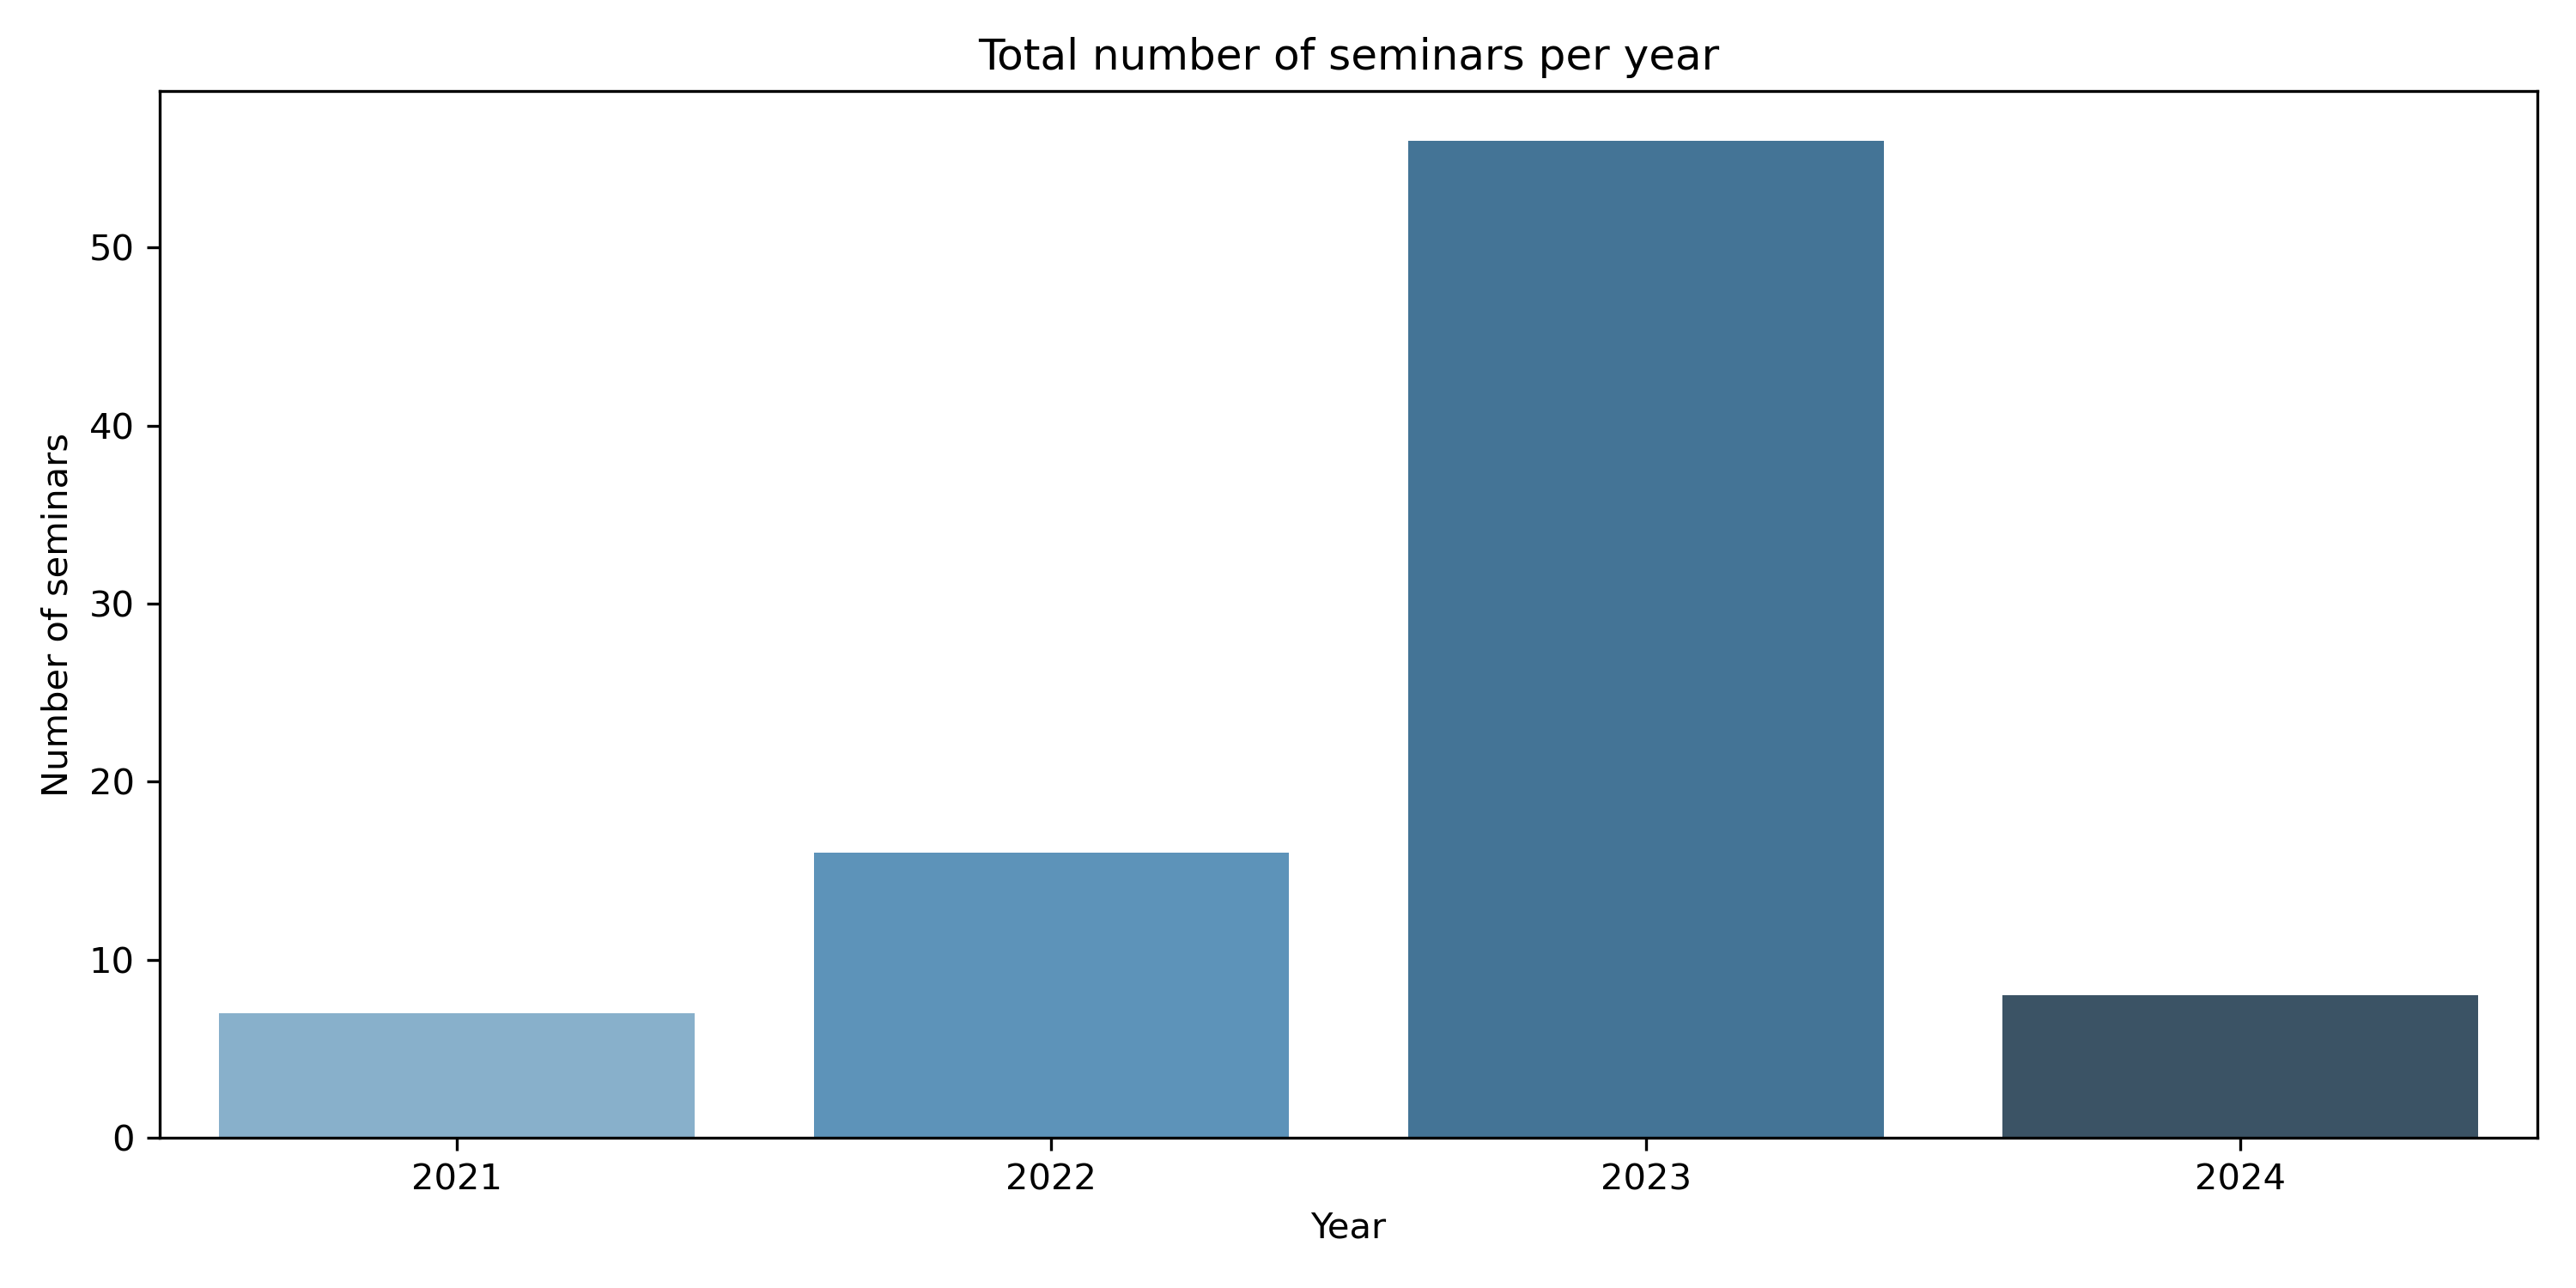
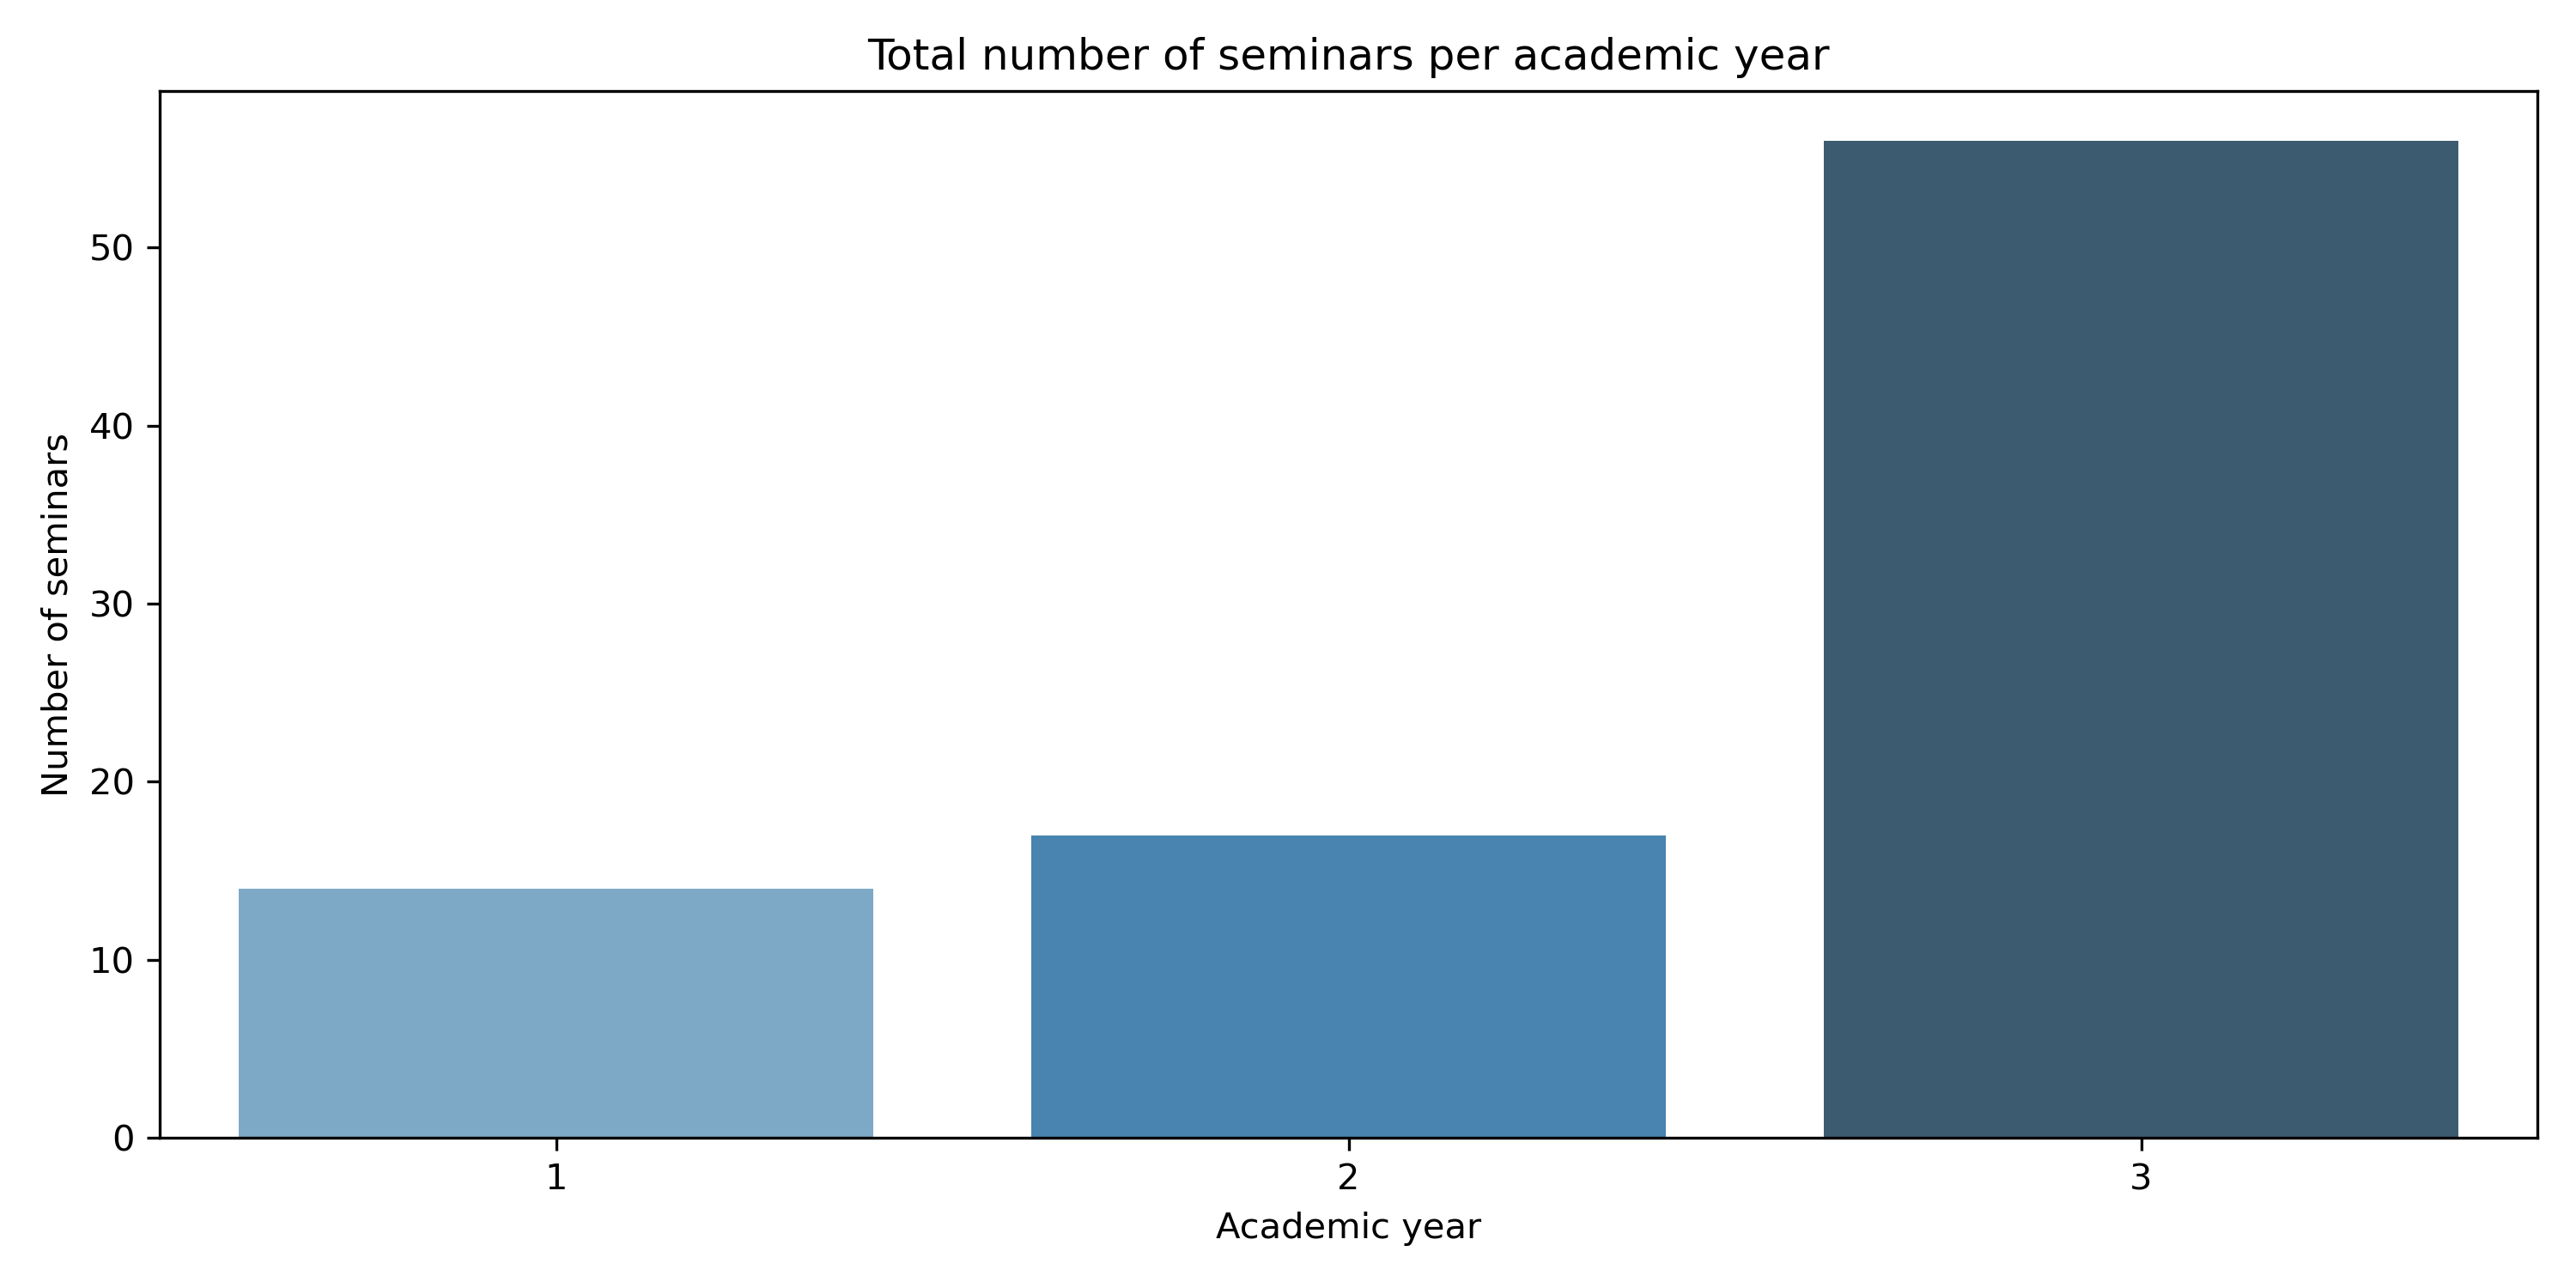
Breaking down my attendance by fiscal and academic year, respectively, gives the following.
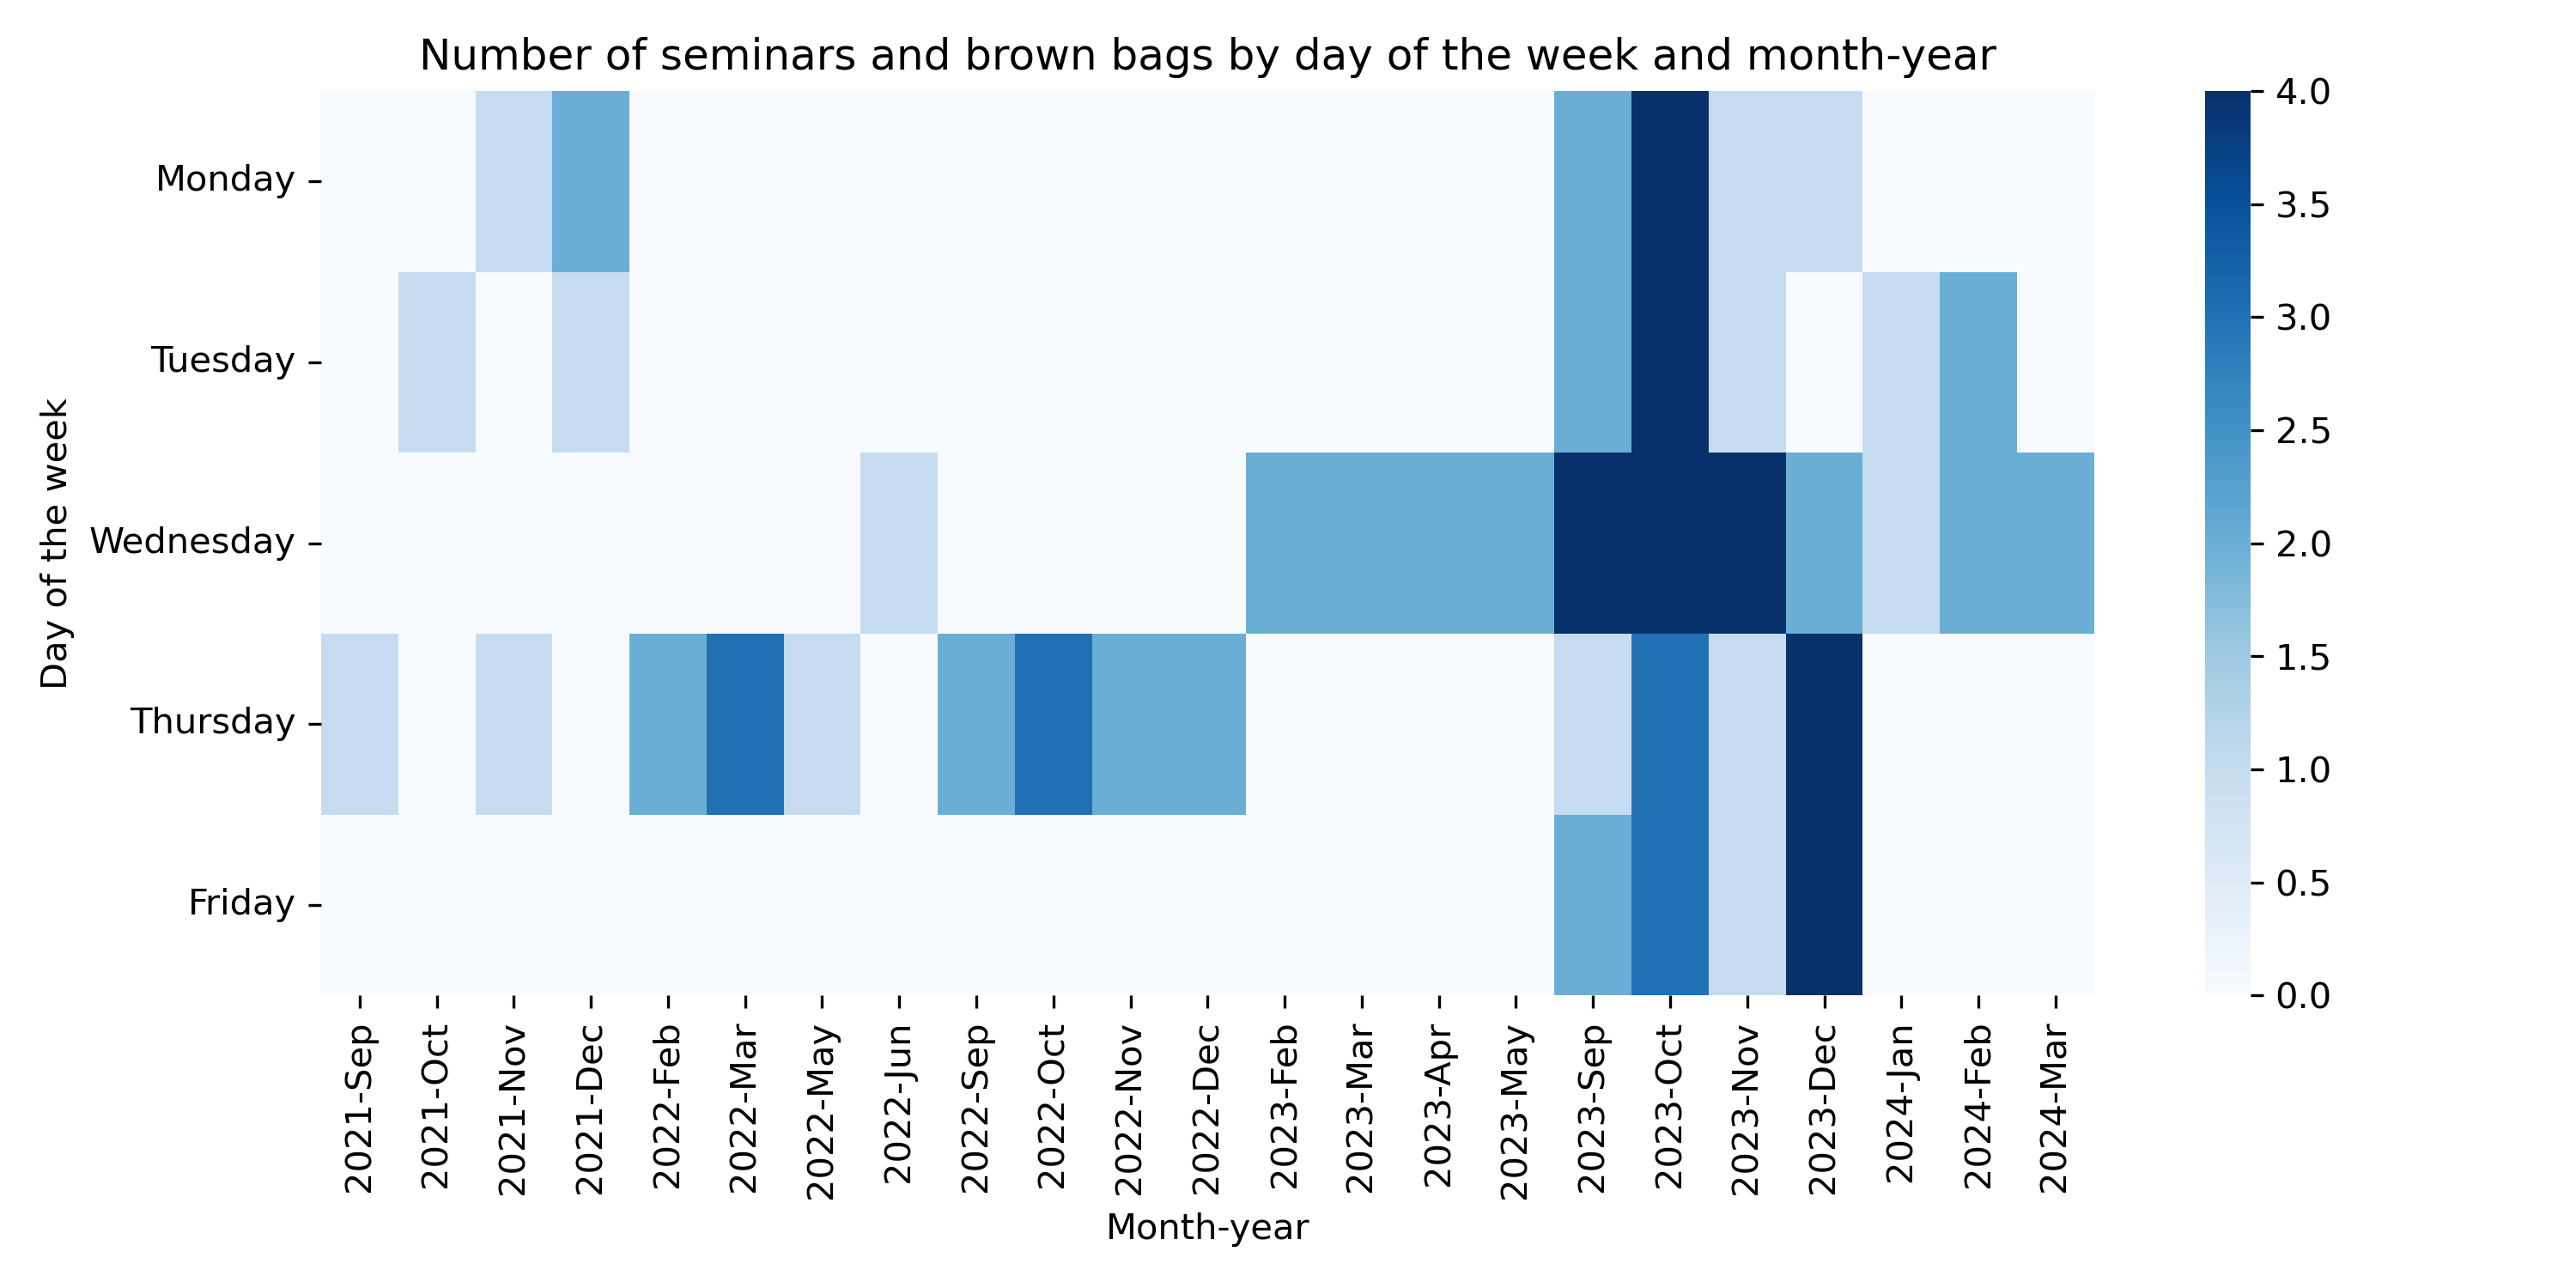
Here’s my favorite figure in this section: Heatmap of day-of-week and month-year. In the fall of 2021, I was still an RA at the Swedish Institute for Social Research, while doing my first semester of the PhD; they had seminars on Tuesdays and Mondays, while my department had seminars on Thursdays. Due to coursework (and the pandemic), I didn’t attend many seminars that first semester. From my second semester onwards, I attended our usual Thursday seminar, 2–3 times a month. Beginning in February of 2023, we changed the seminar day to Wednesdays. Finally, Beginning in September of 2023, I attended the IRLE seminars every Wednesday in Berkeley, plus a bunch of other seminars spread out throughout the week!
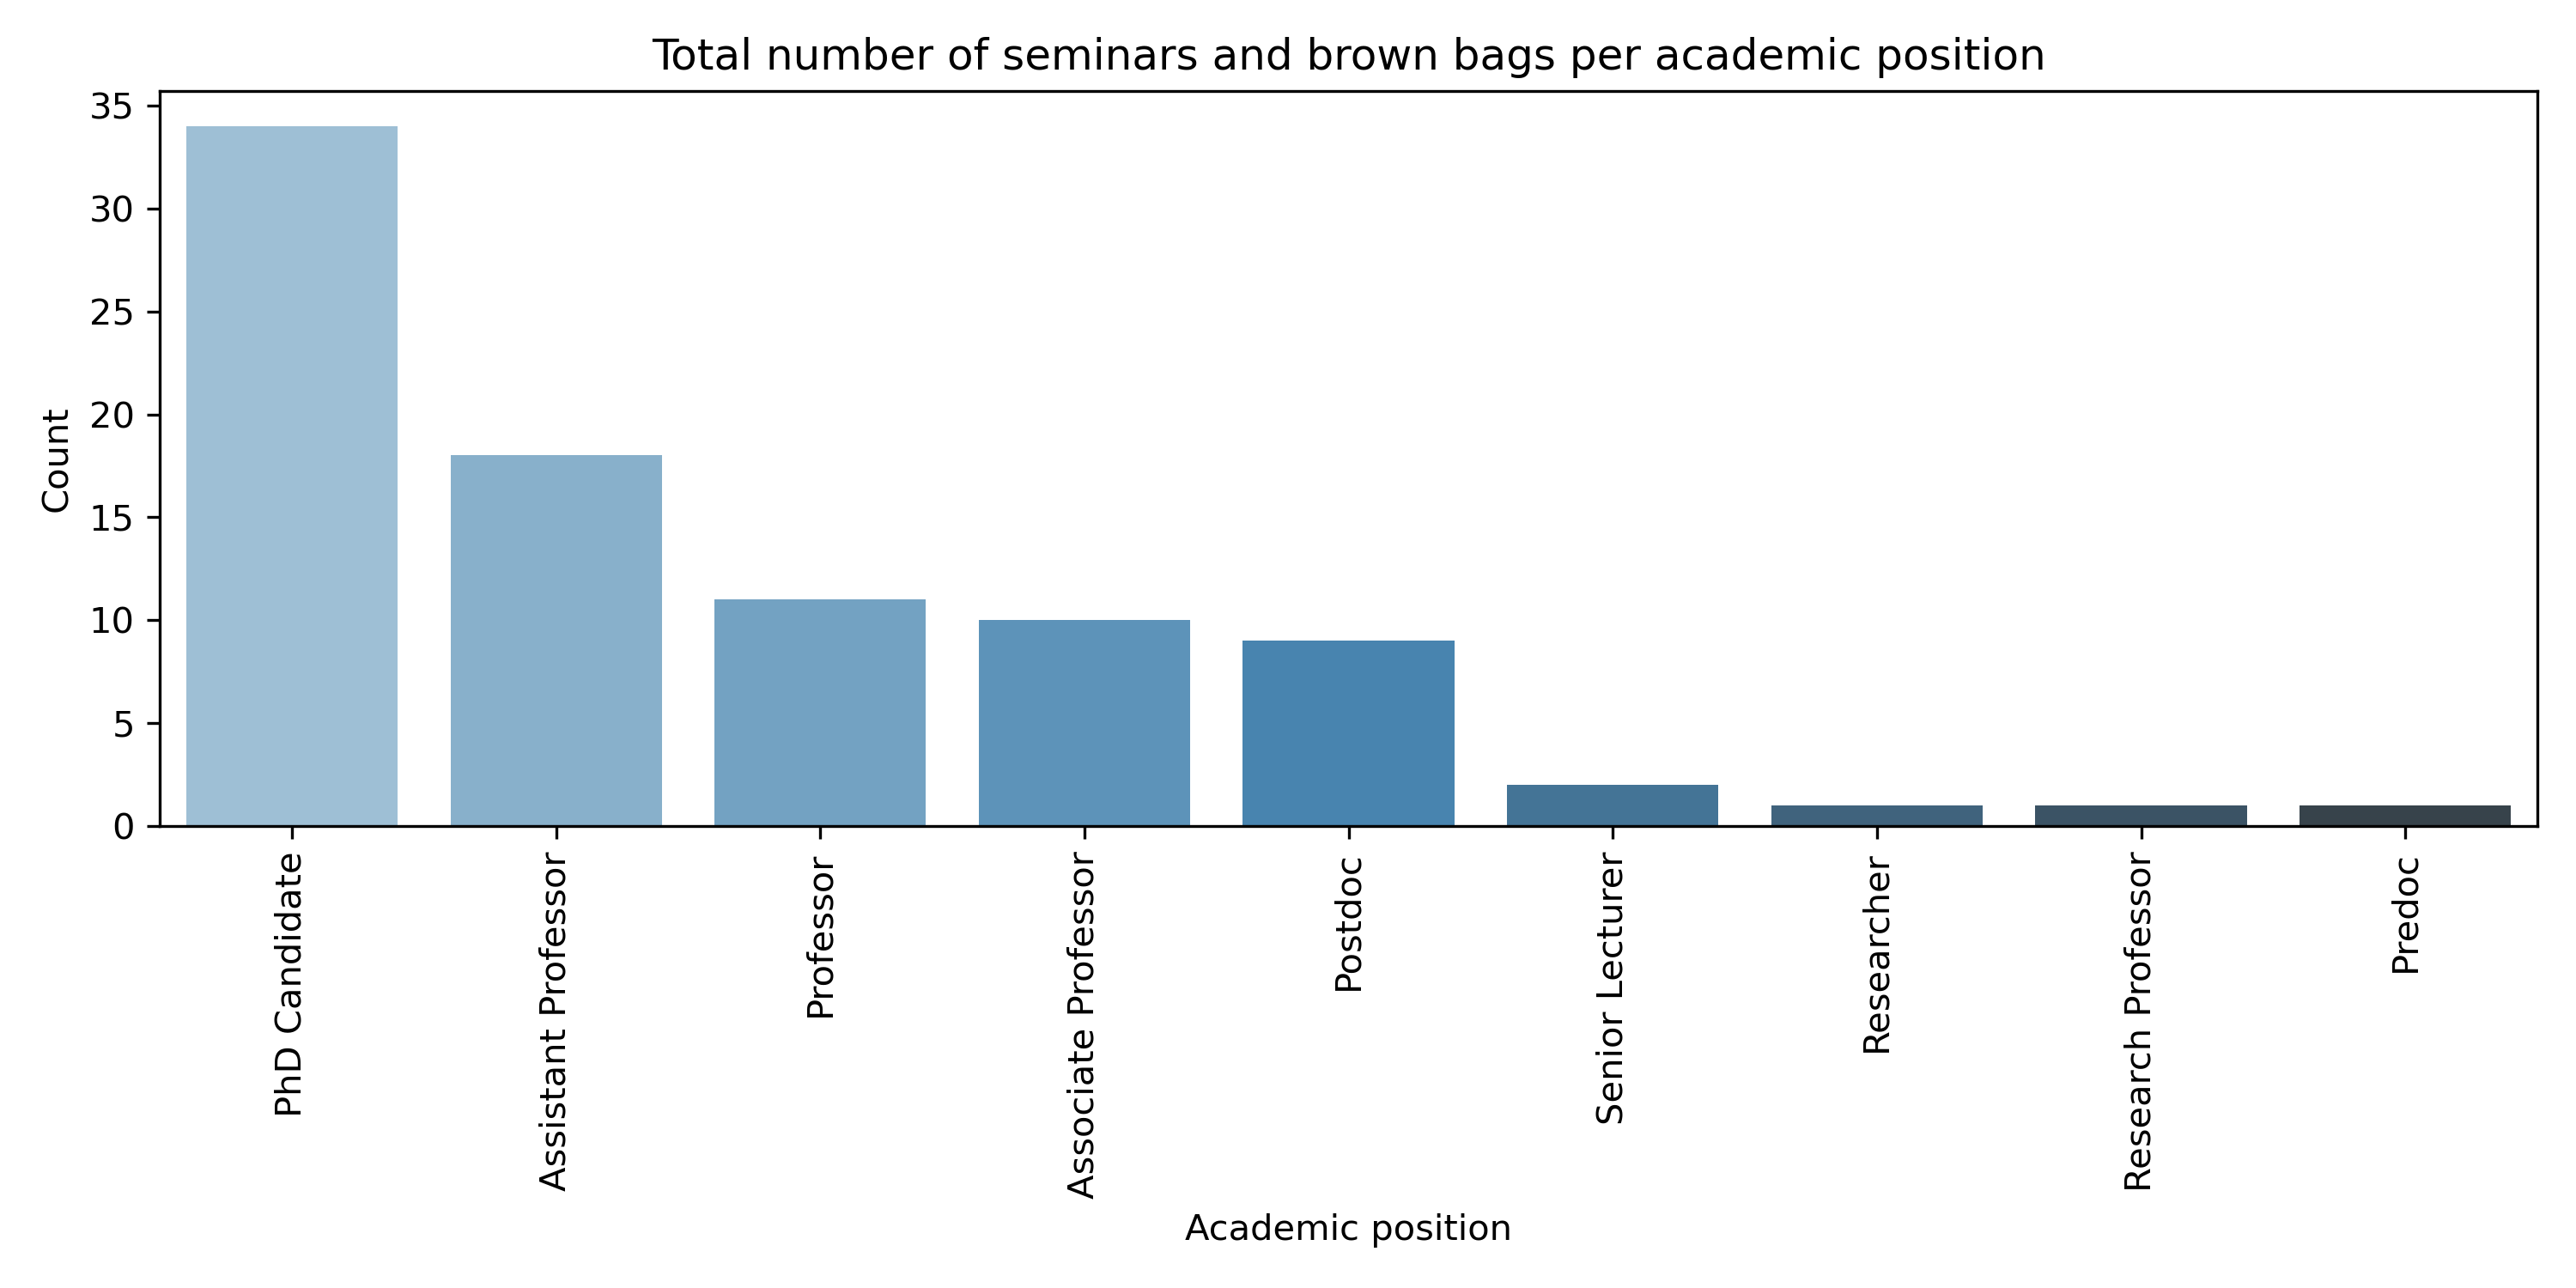
Not surprising, most presentations are given by PhD students or APs.
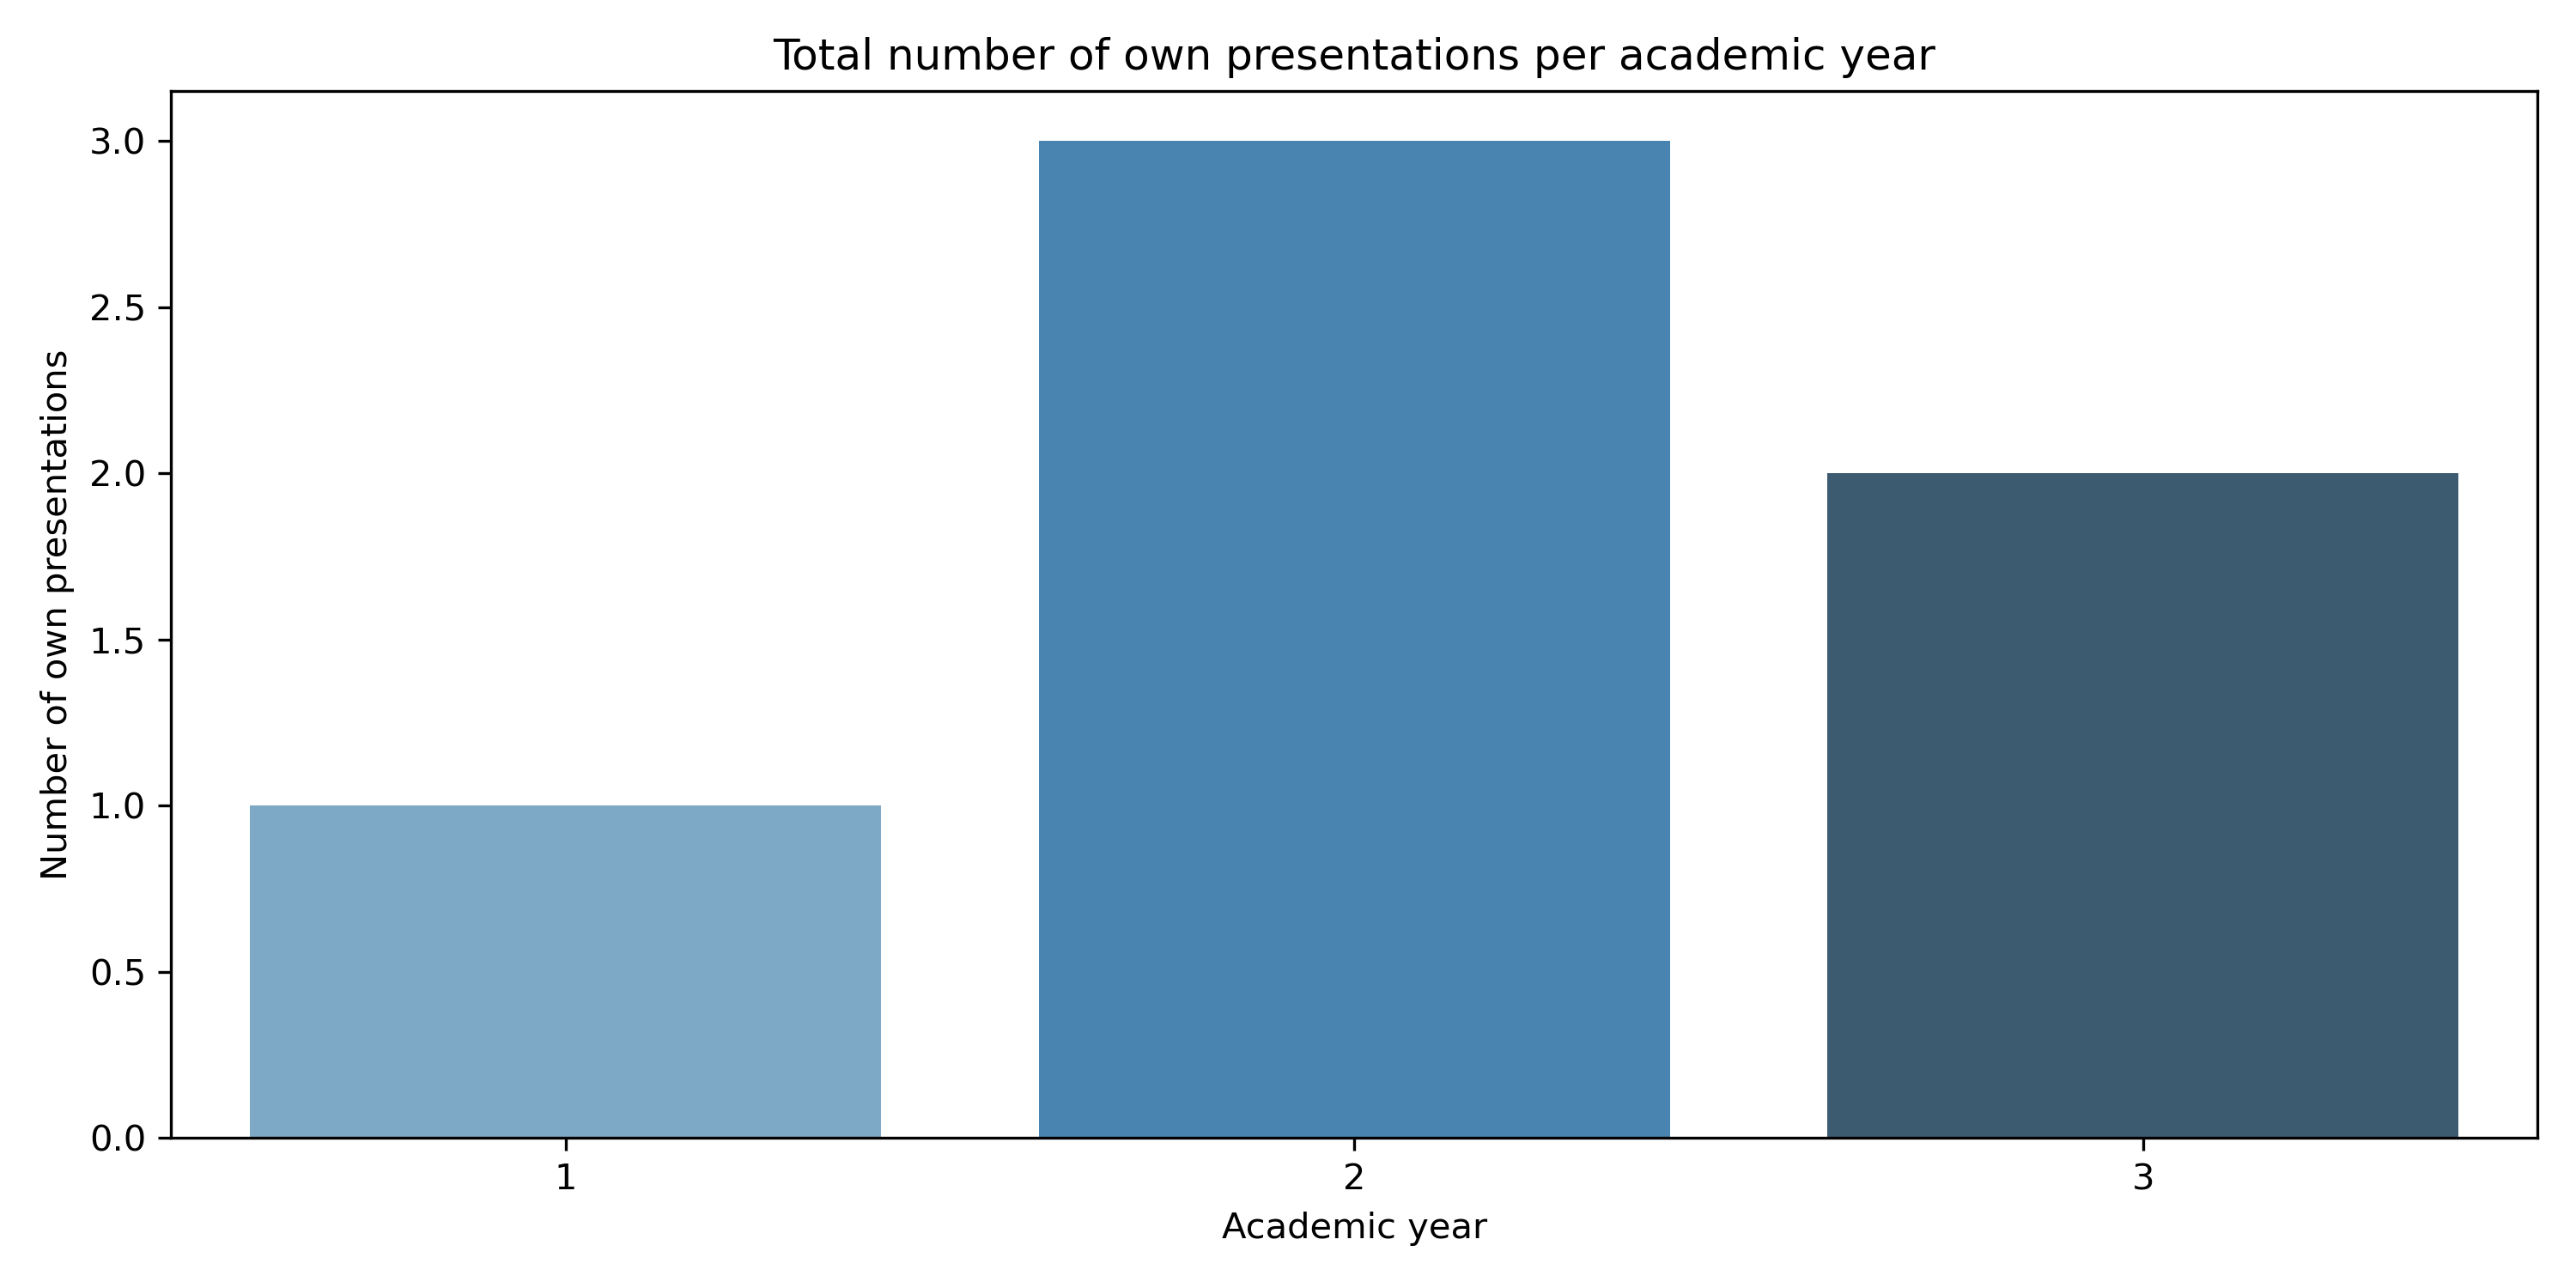
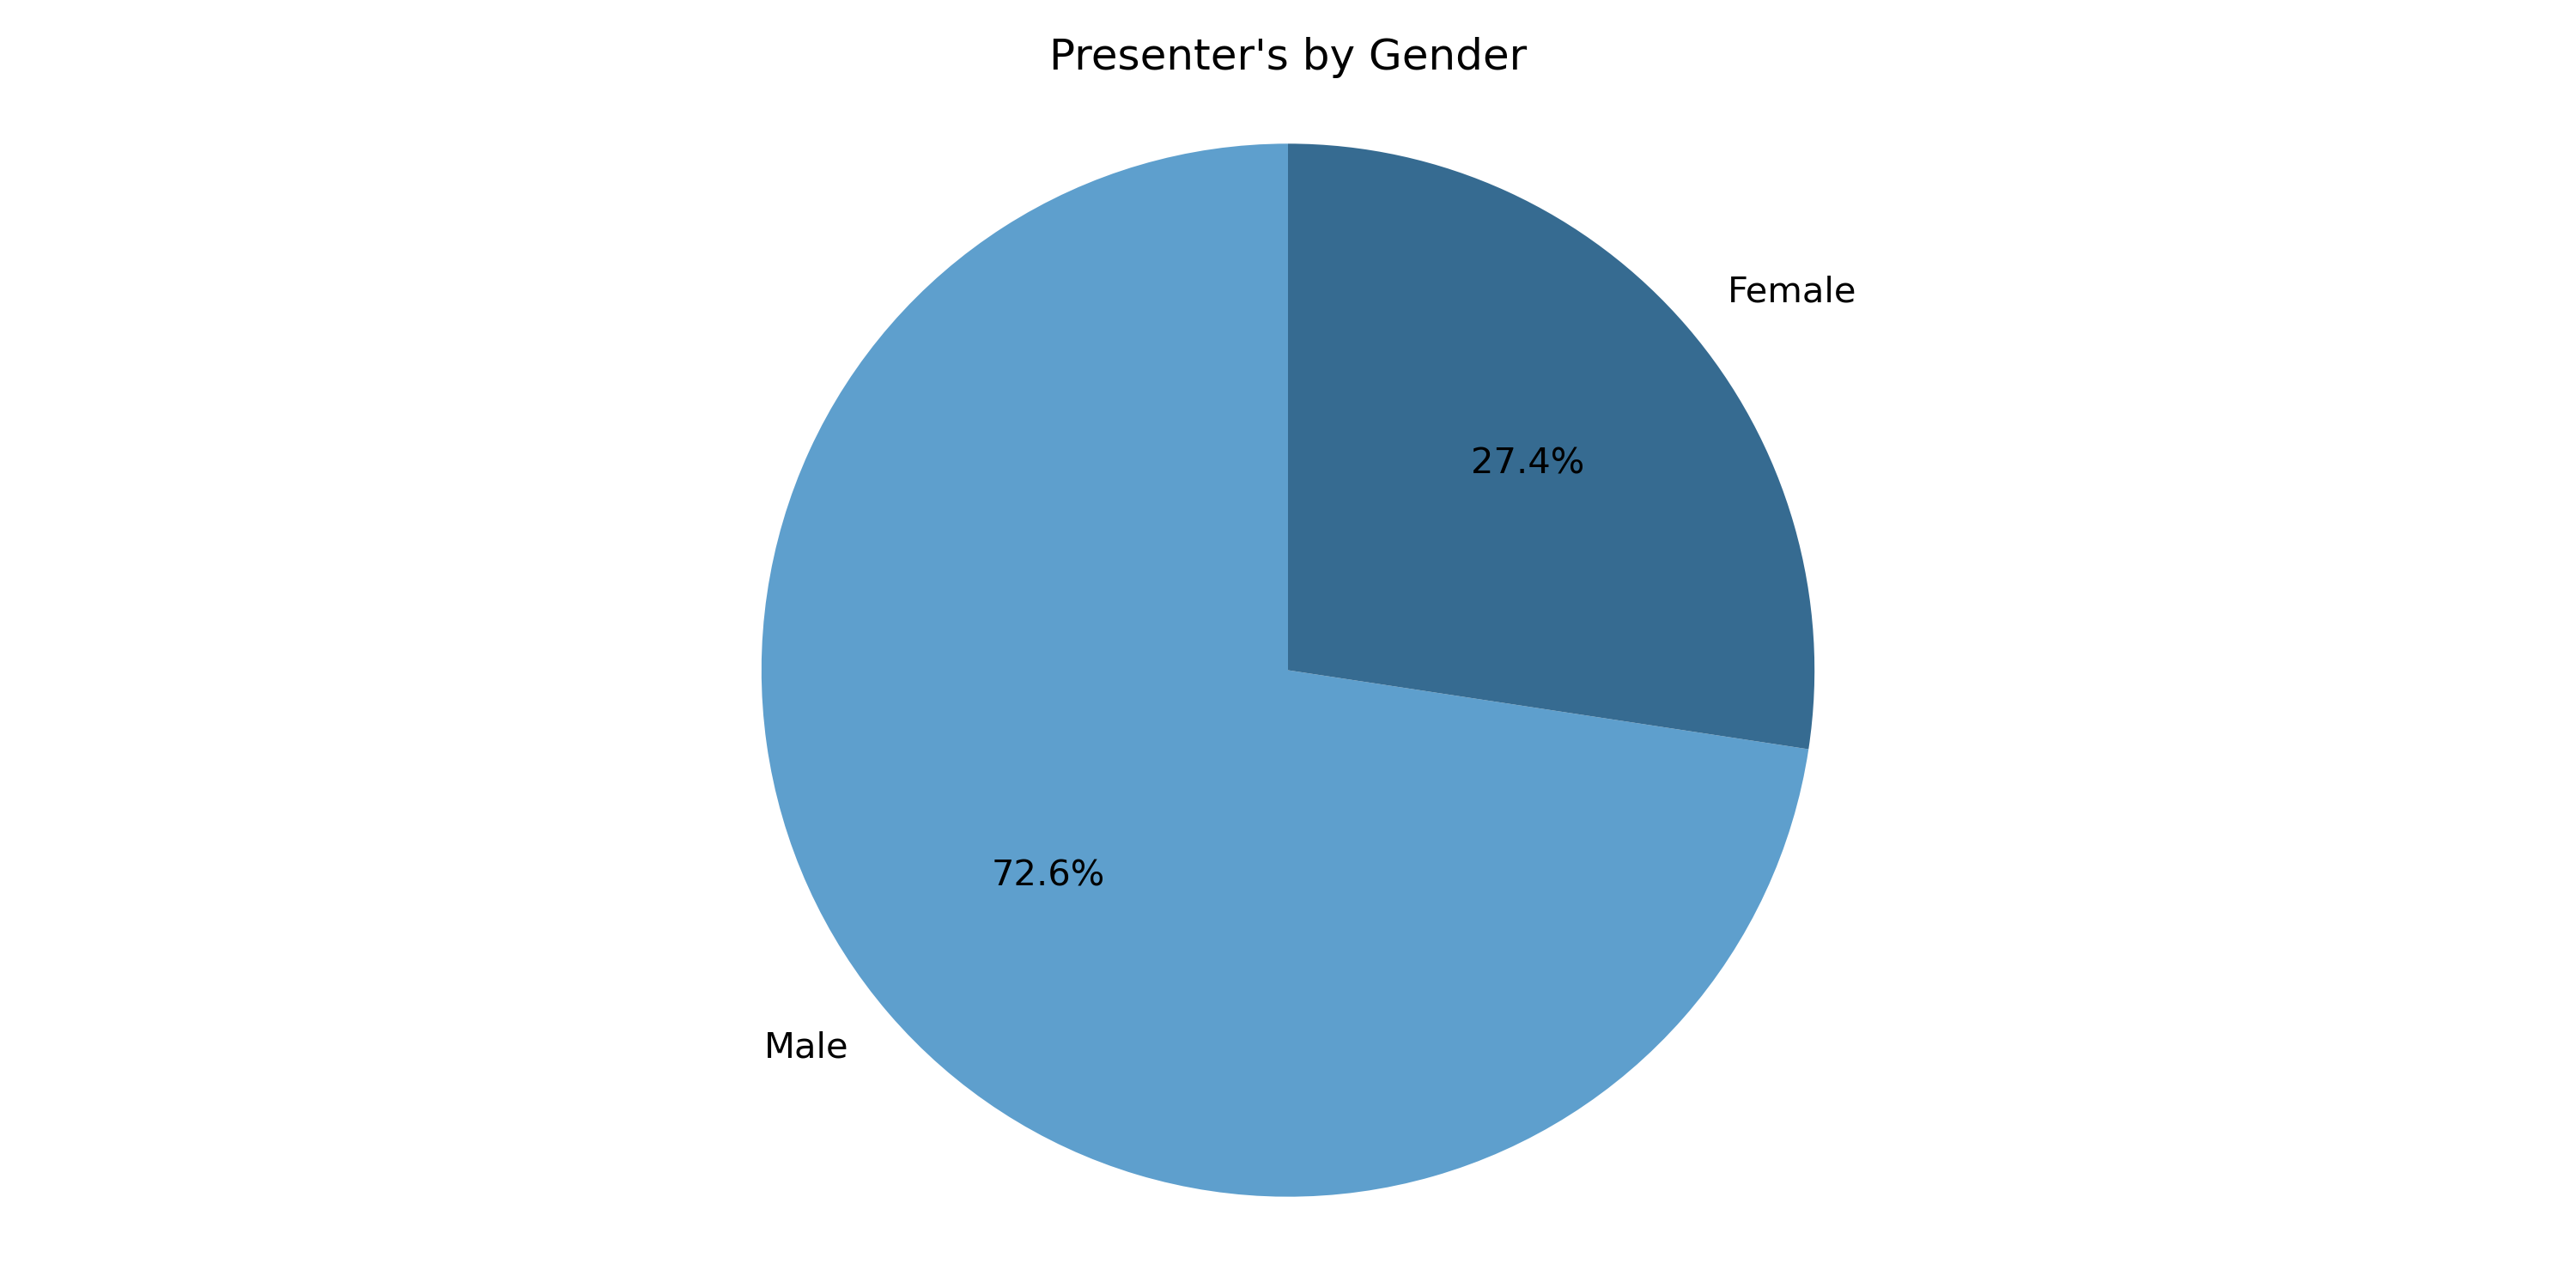
I’ve had the honor of presenting a few times myself:
Econ gets a lot of crap for its gender imbalance. And it has a highly skewed gender distribution. This is looking at presenters’ genders, but the share of men would be even higher if I counted per presentation instead of per presenter (since I’ve seen some people present multiple times, and it’s mostly been men).
If you are like me*, you’ve gone around wondering the following:
Which is more popular among economists, Google Sites or Github Pages?
I don’t have a definitive answer, but use this figure to argue about it at the pub.†
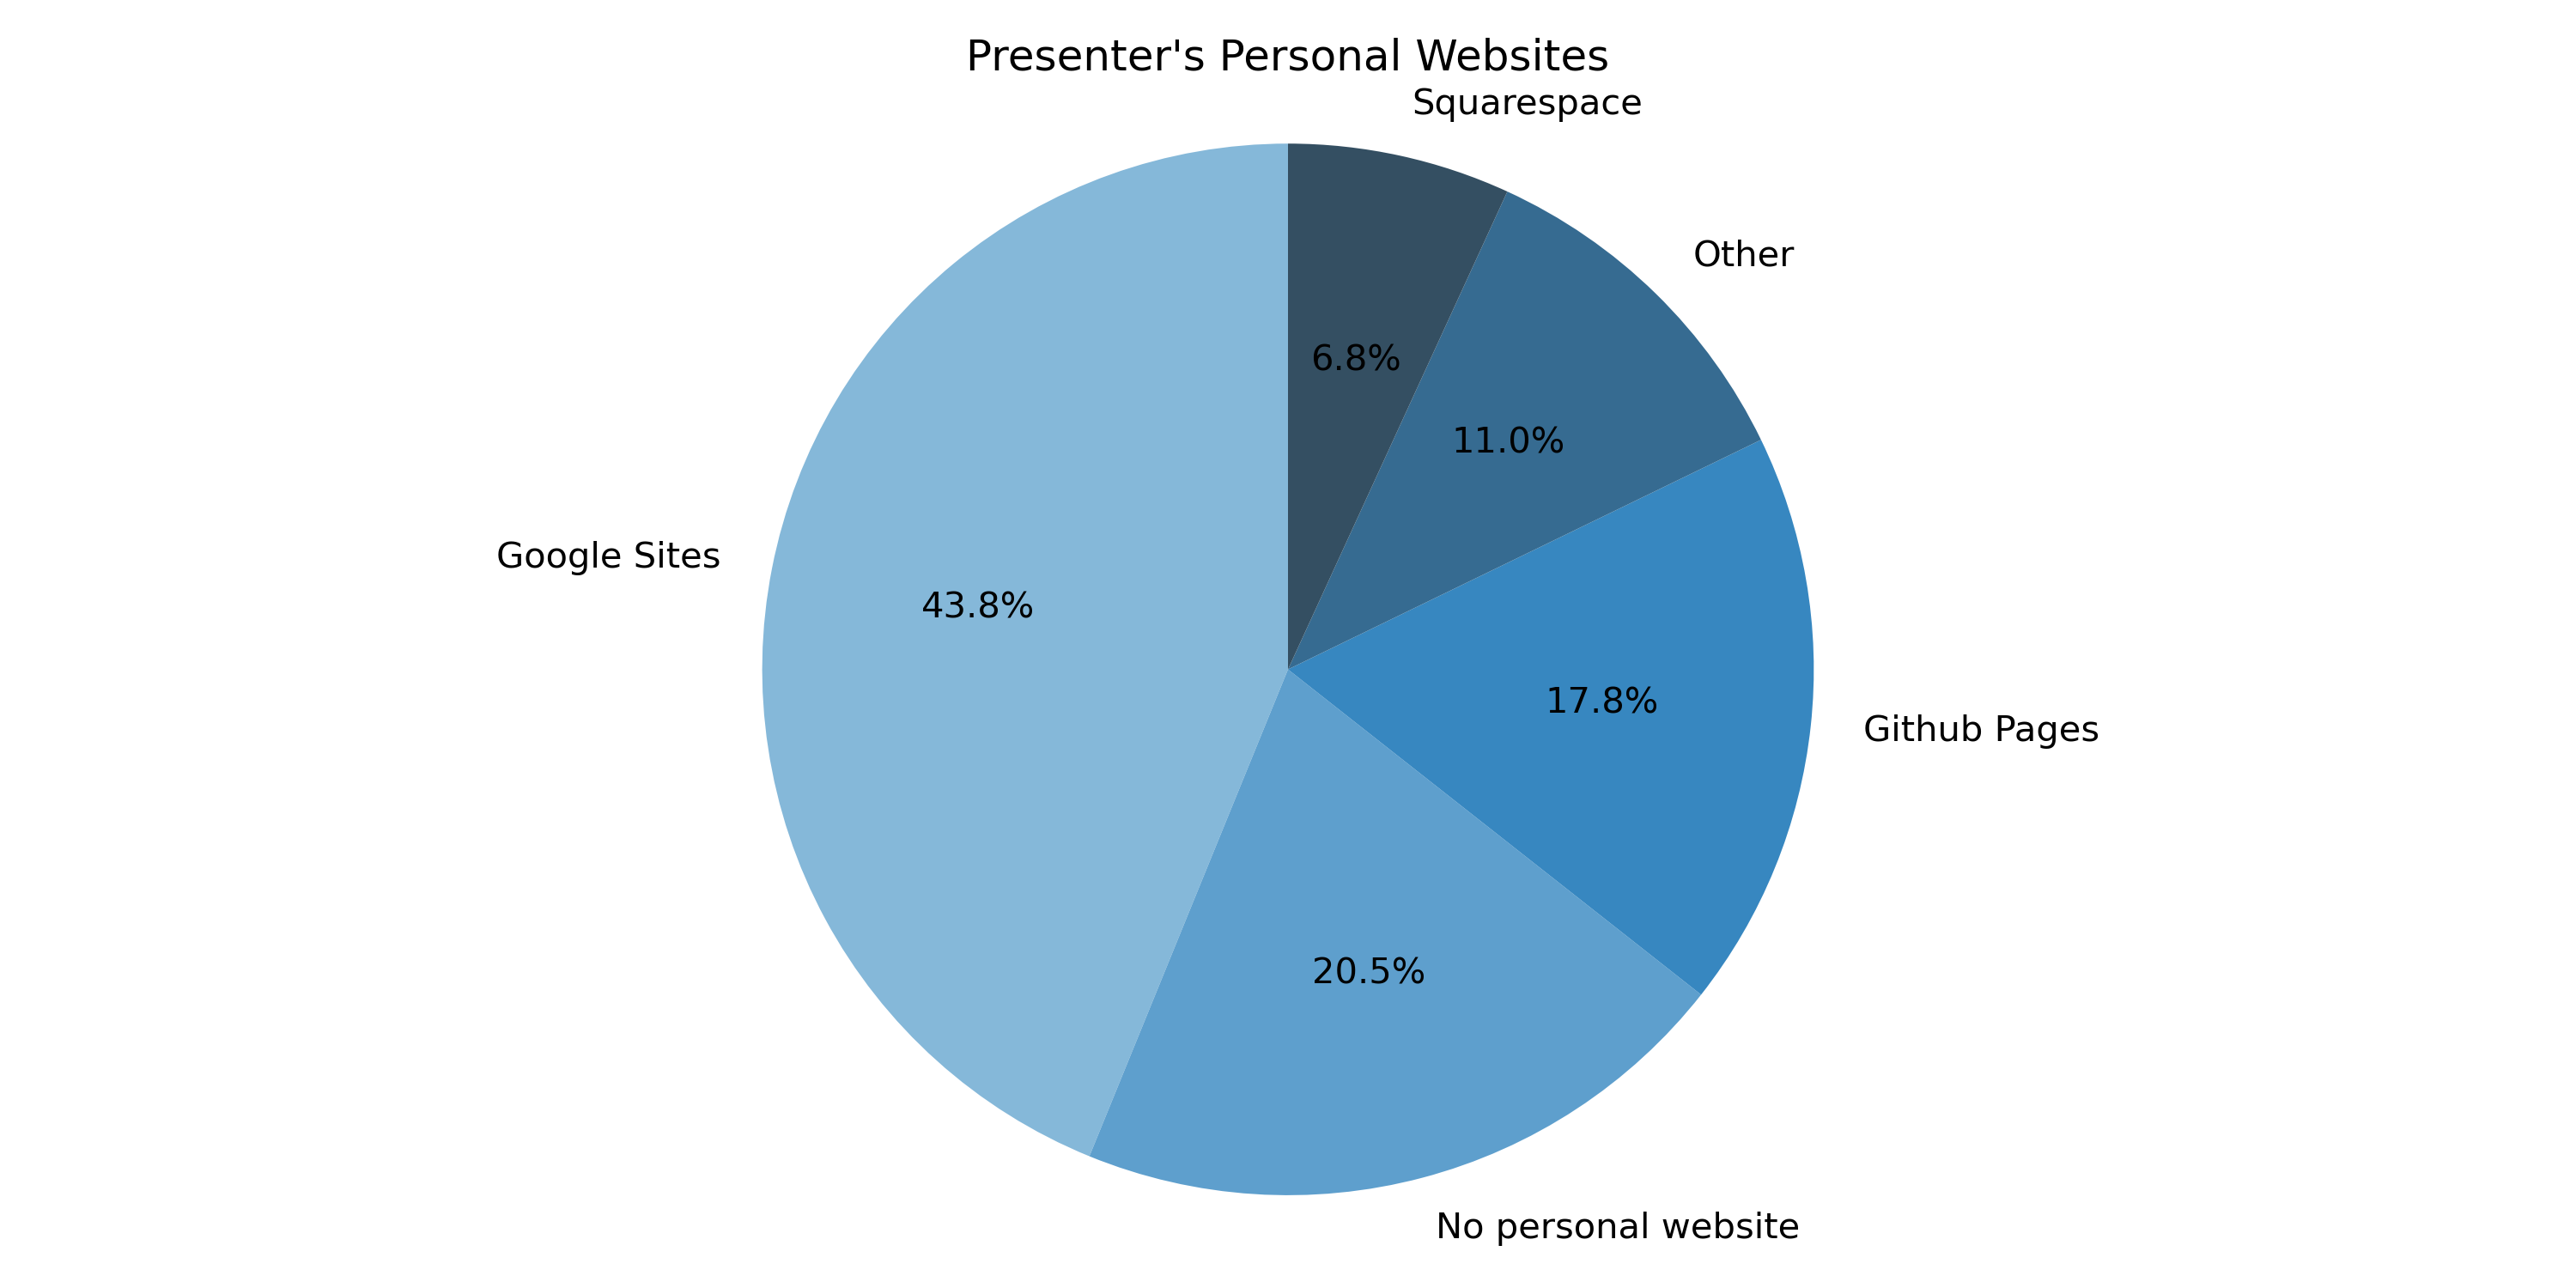
* Congrats! That’s a big win. † How representative is my sample to the sample of all economists? Squarespace + Google Domains = True. Google Sites has a relative majority, but is that all that counts to declare victory? I will start campaigning to get people with no personal websites to create a Github Pages.
Uploaded 2023–11–20; Last updated 2024–11-25
2 Exploring the Lex Fridman Podcast
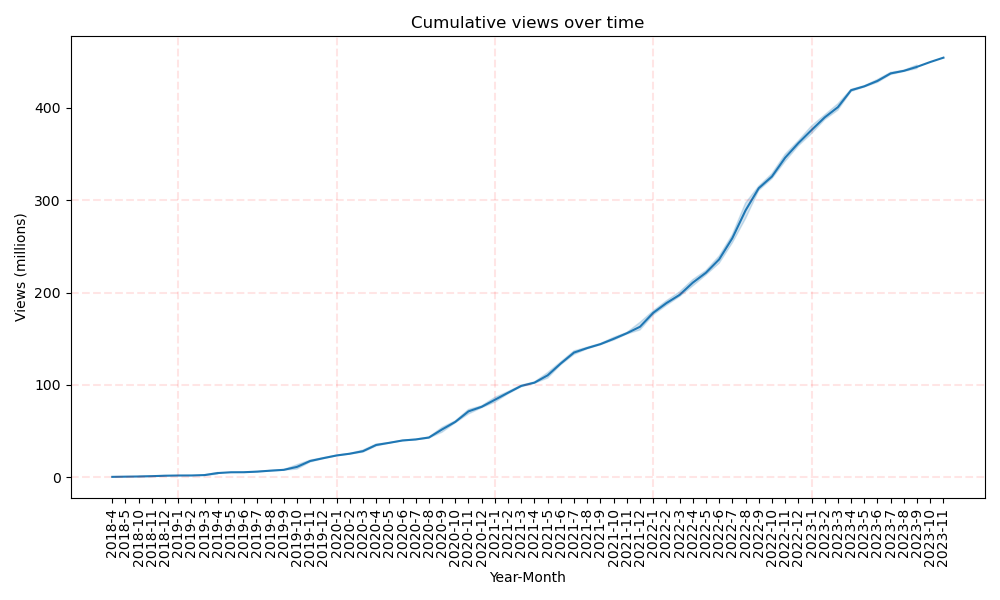
I love the Lex Fridman podcast. So I did some digging. The following is based on data from YouTube.
First, the podcast has had a lot of views. Over 400 million views.
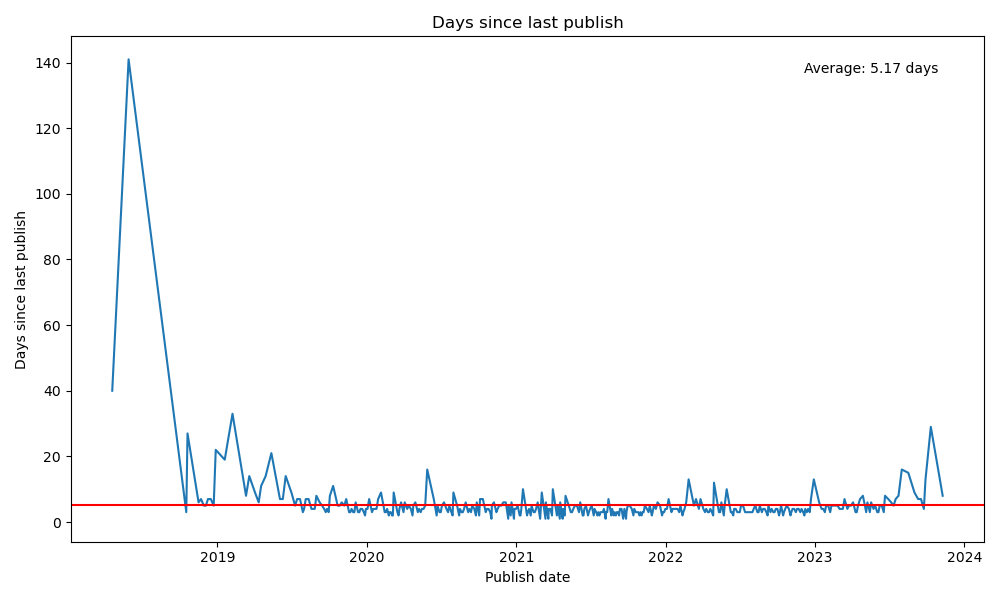
Lex averages 5 days between episodes and has done so consistently for a few years now.
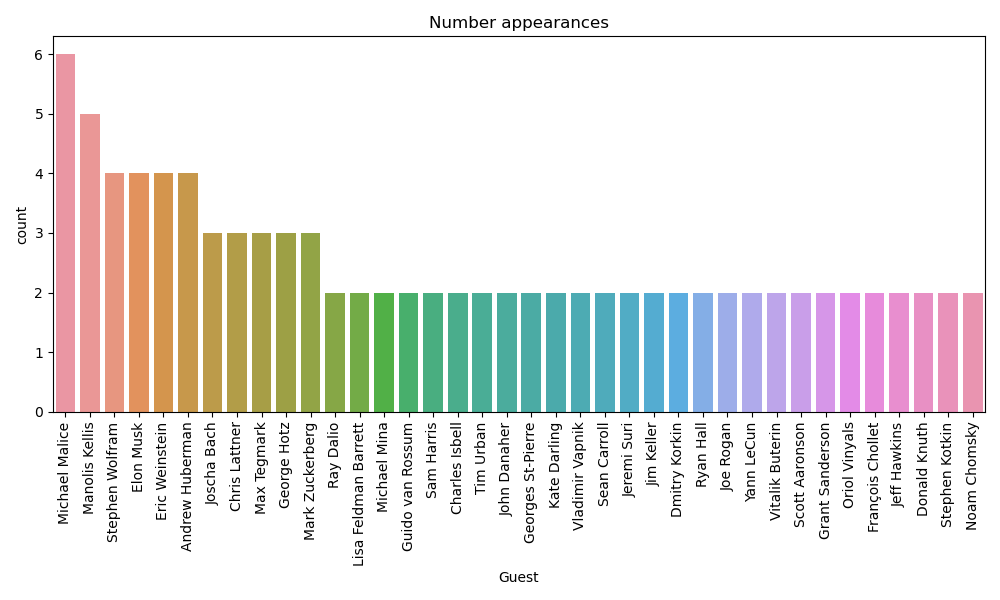
To get a feeling for what the podcast is about, let’s look at its guests.
First, we have the most recurring interviewees. You can form your own opinion about them,
but I find the breadth of their fields fascinating. Physcists, programmers, philosophers, fighters, podcasters, teachers, and more!
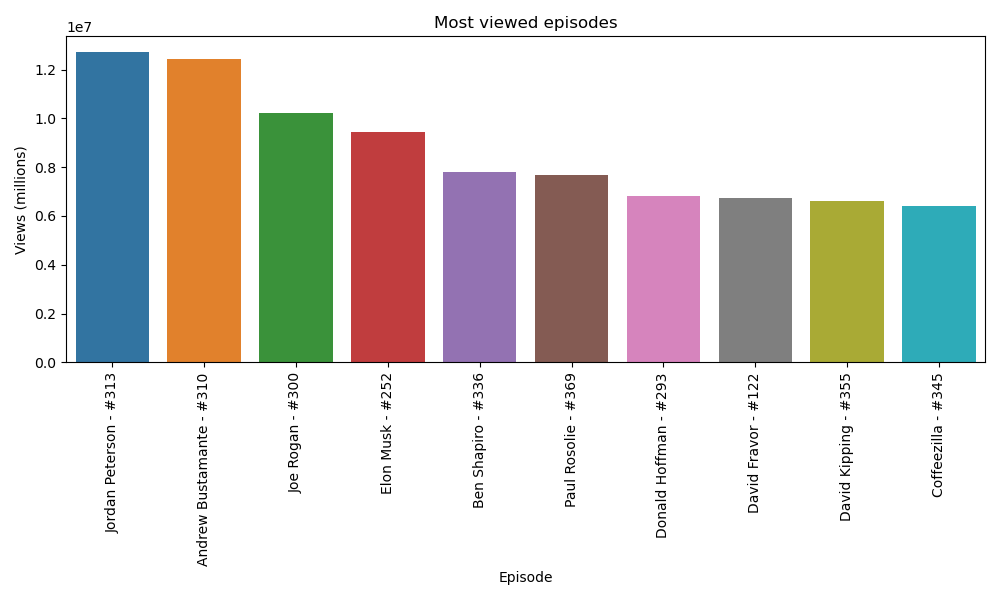
The podcast’s most viewed episodes (with over 12 million for first place).
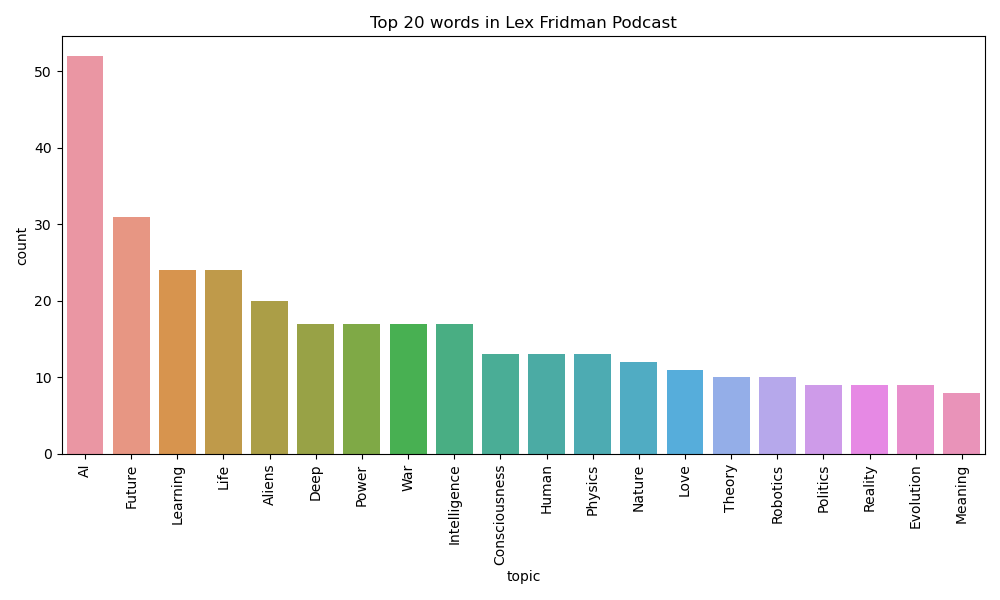
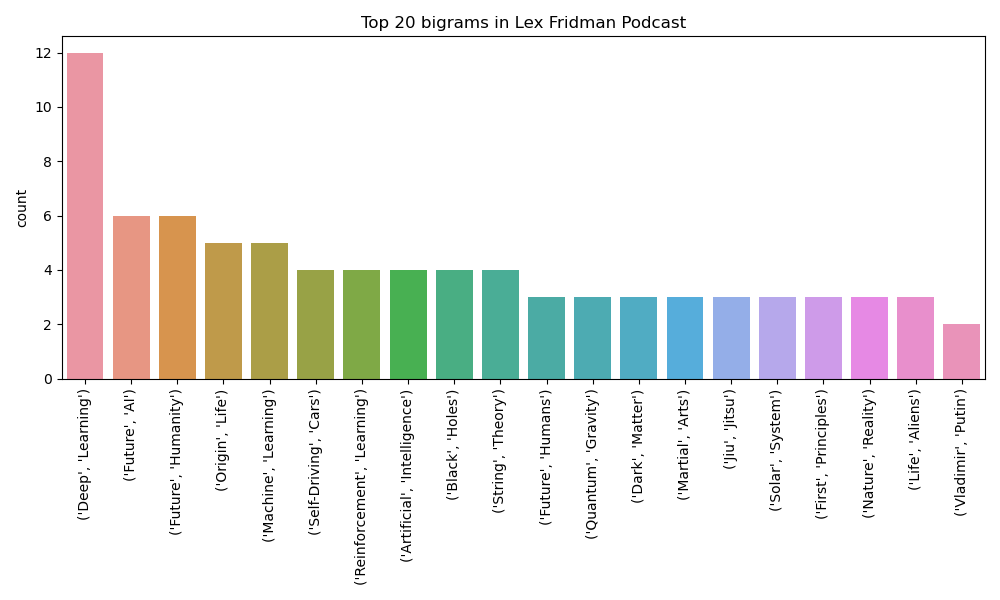
So what do they discuss on these podcasts? Based off of the titles, here’s the top 20 words and bigrams.
Basically, a lot of AI, physics, human nature, and our future.
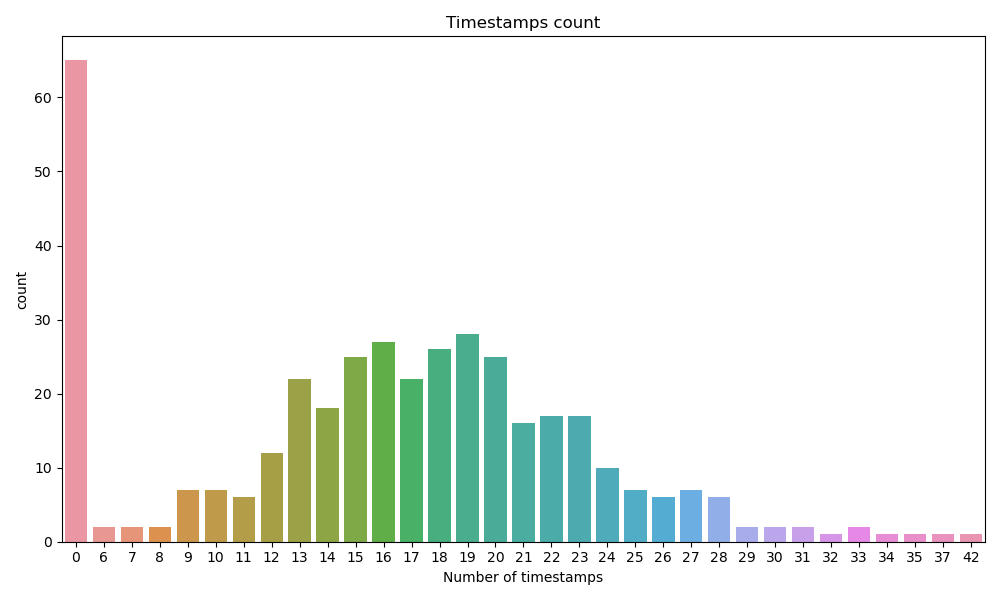
Beyond the title, they must talk about several different stuff in the actual interview.
For the episodes with timestamps available, we can see the average number of topics per episode is around 18.
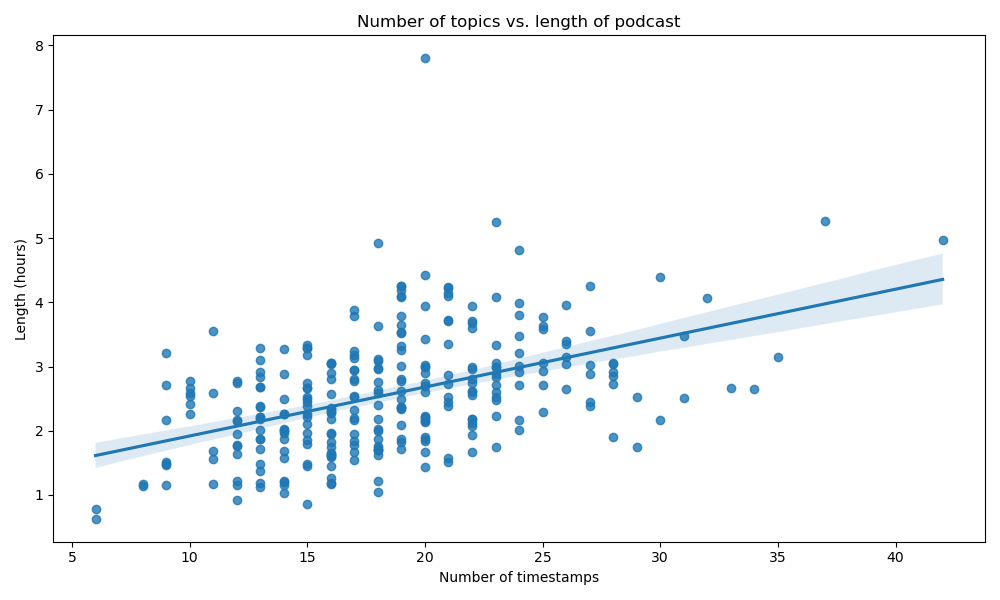
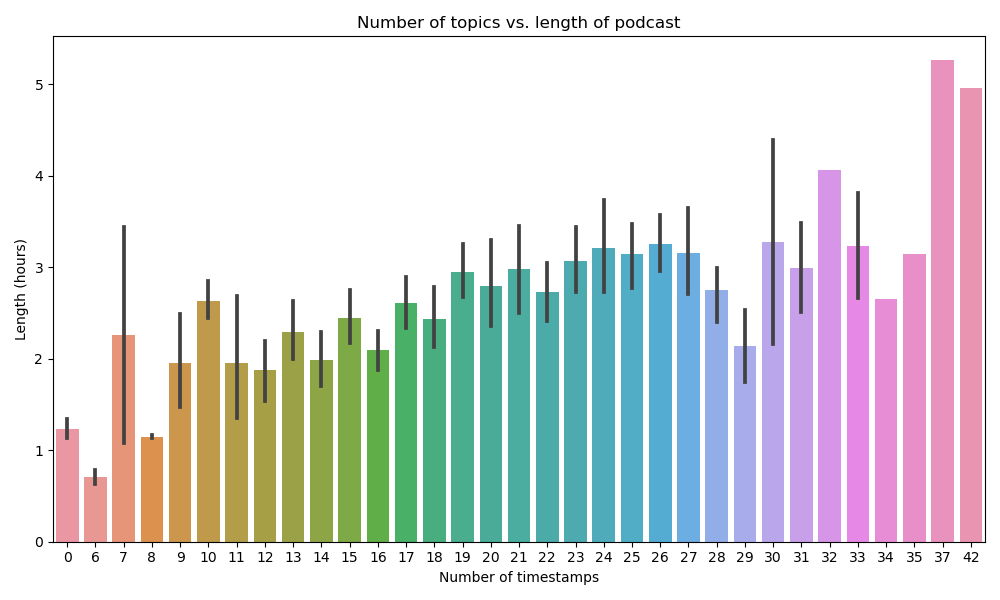
The length of the episode correlates positively with the length of the episode.
My favorite outlier is Balaji Srinivasan’s episode, at an impressive 7 hours 47 minutes and 52 seconds.
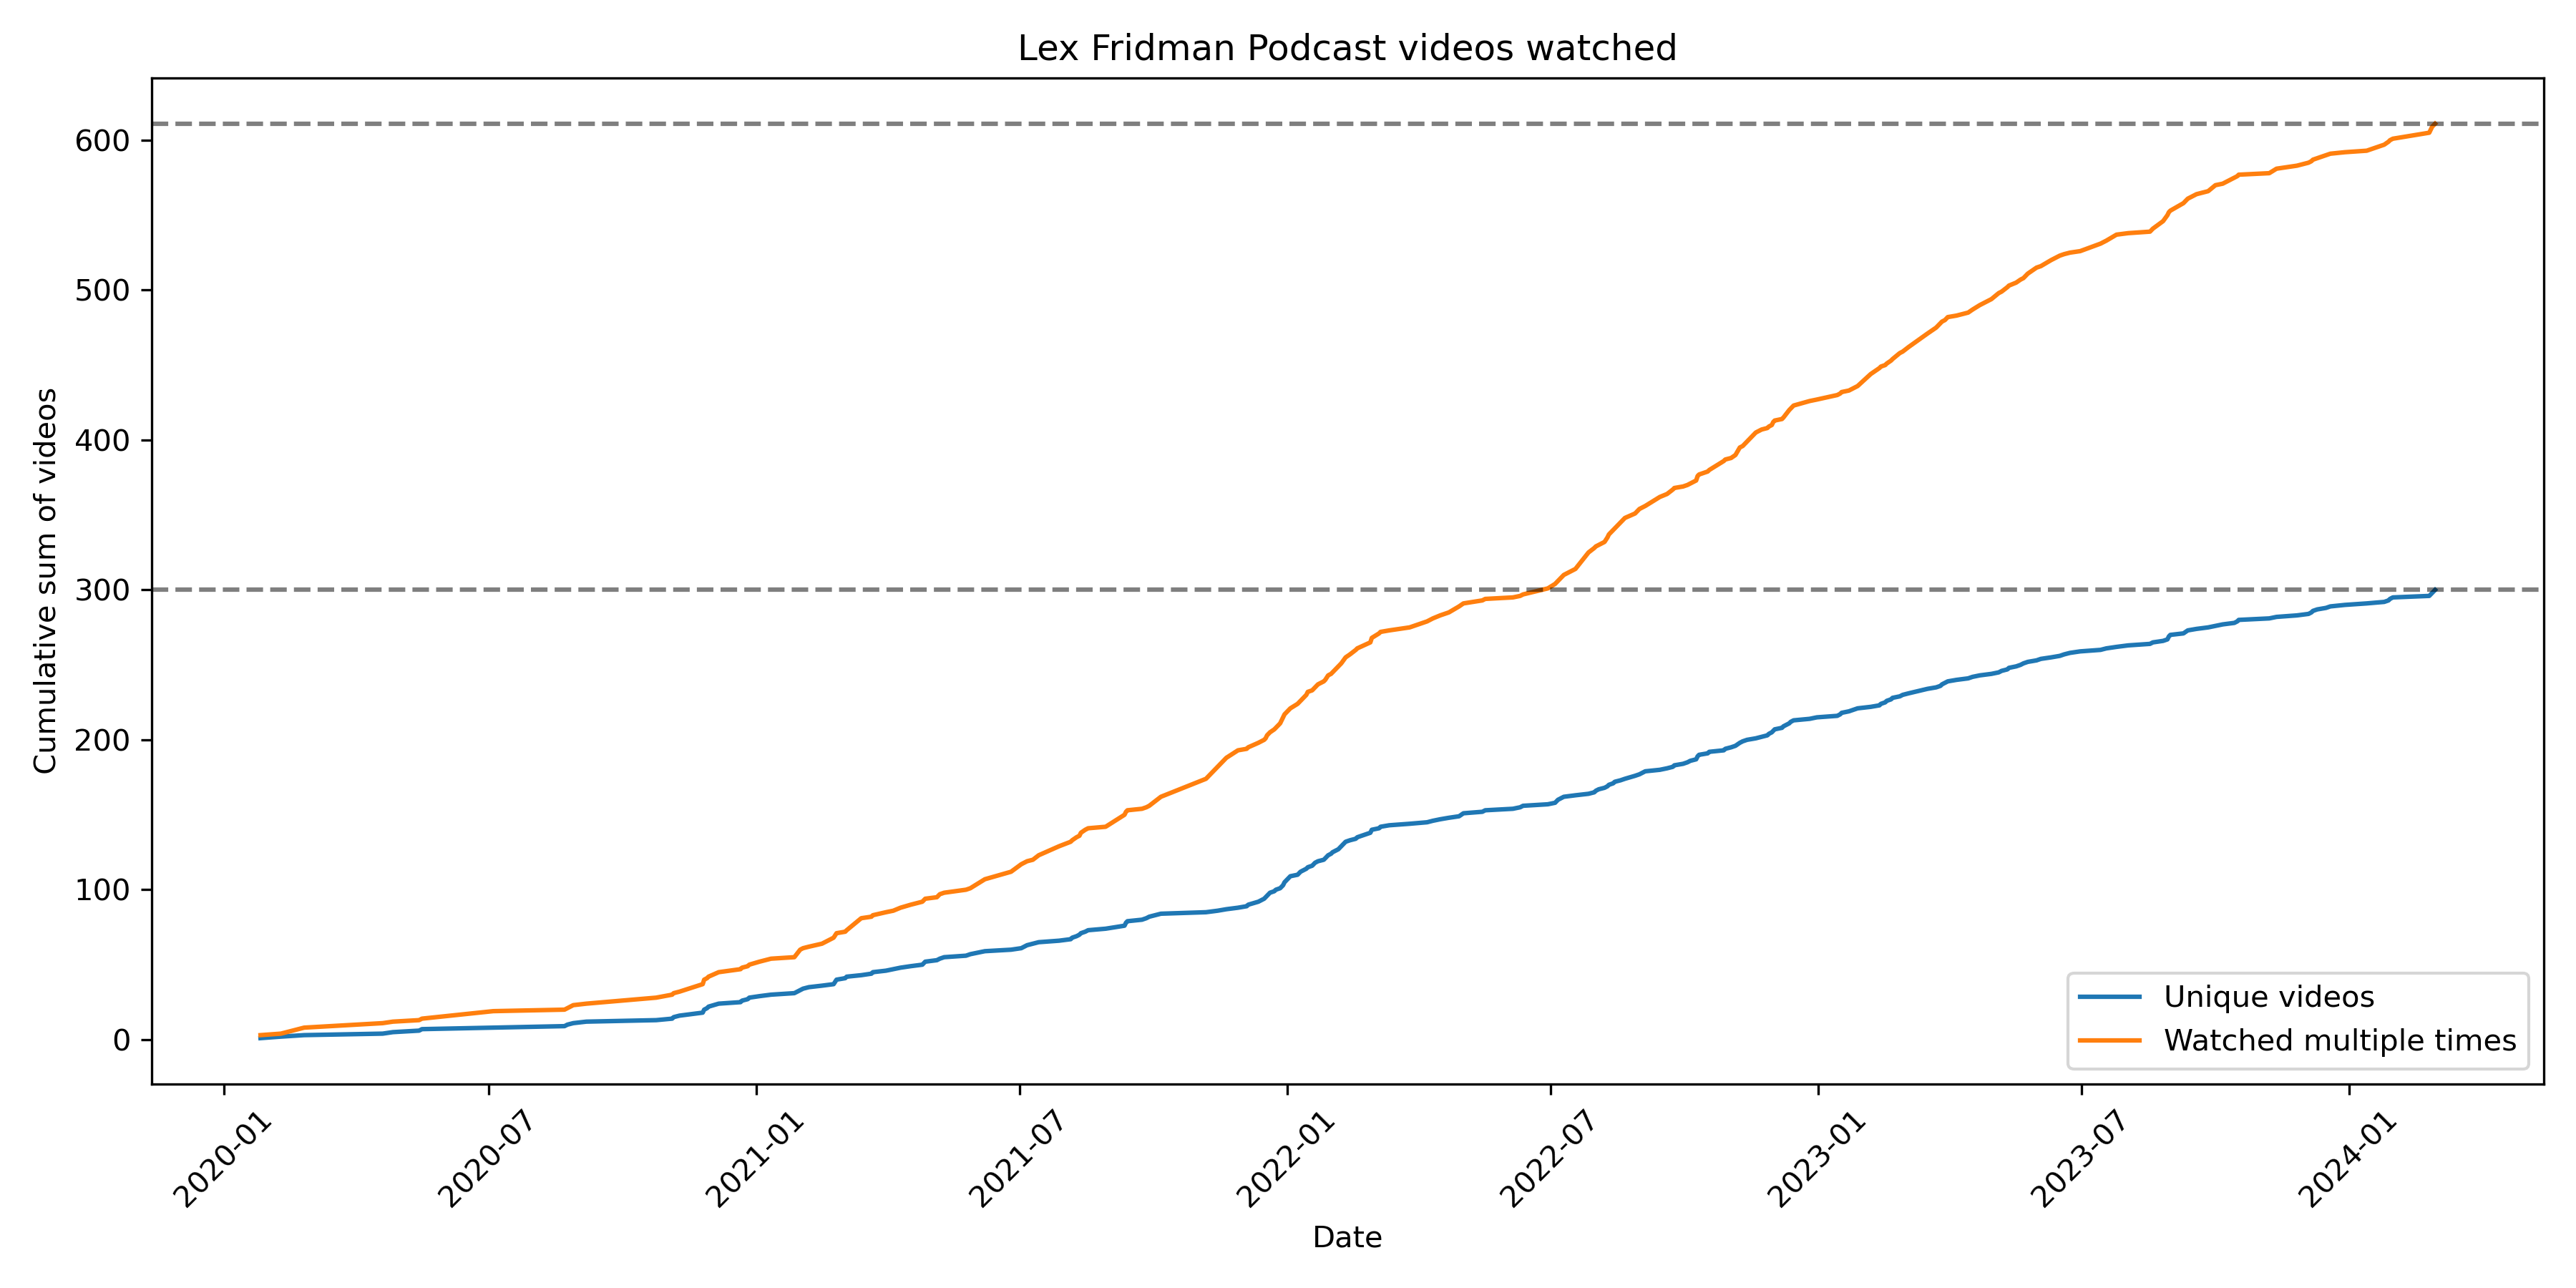
My viewership of the Lex Fridman Podcast: An update
So, I recently accessed my YouTube watch history. This is where I primarily watch and listen to podcasts.
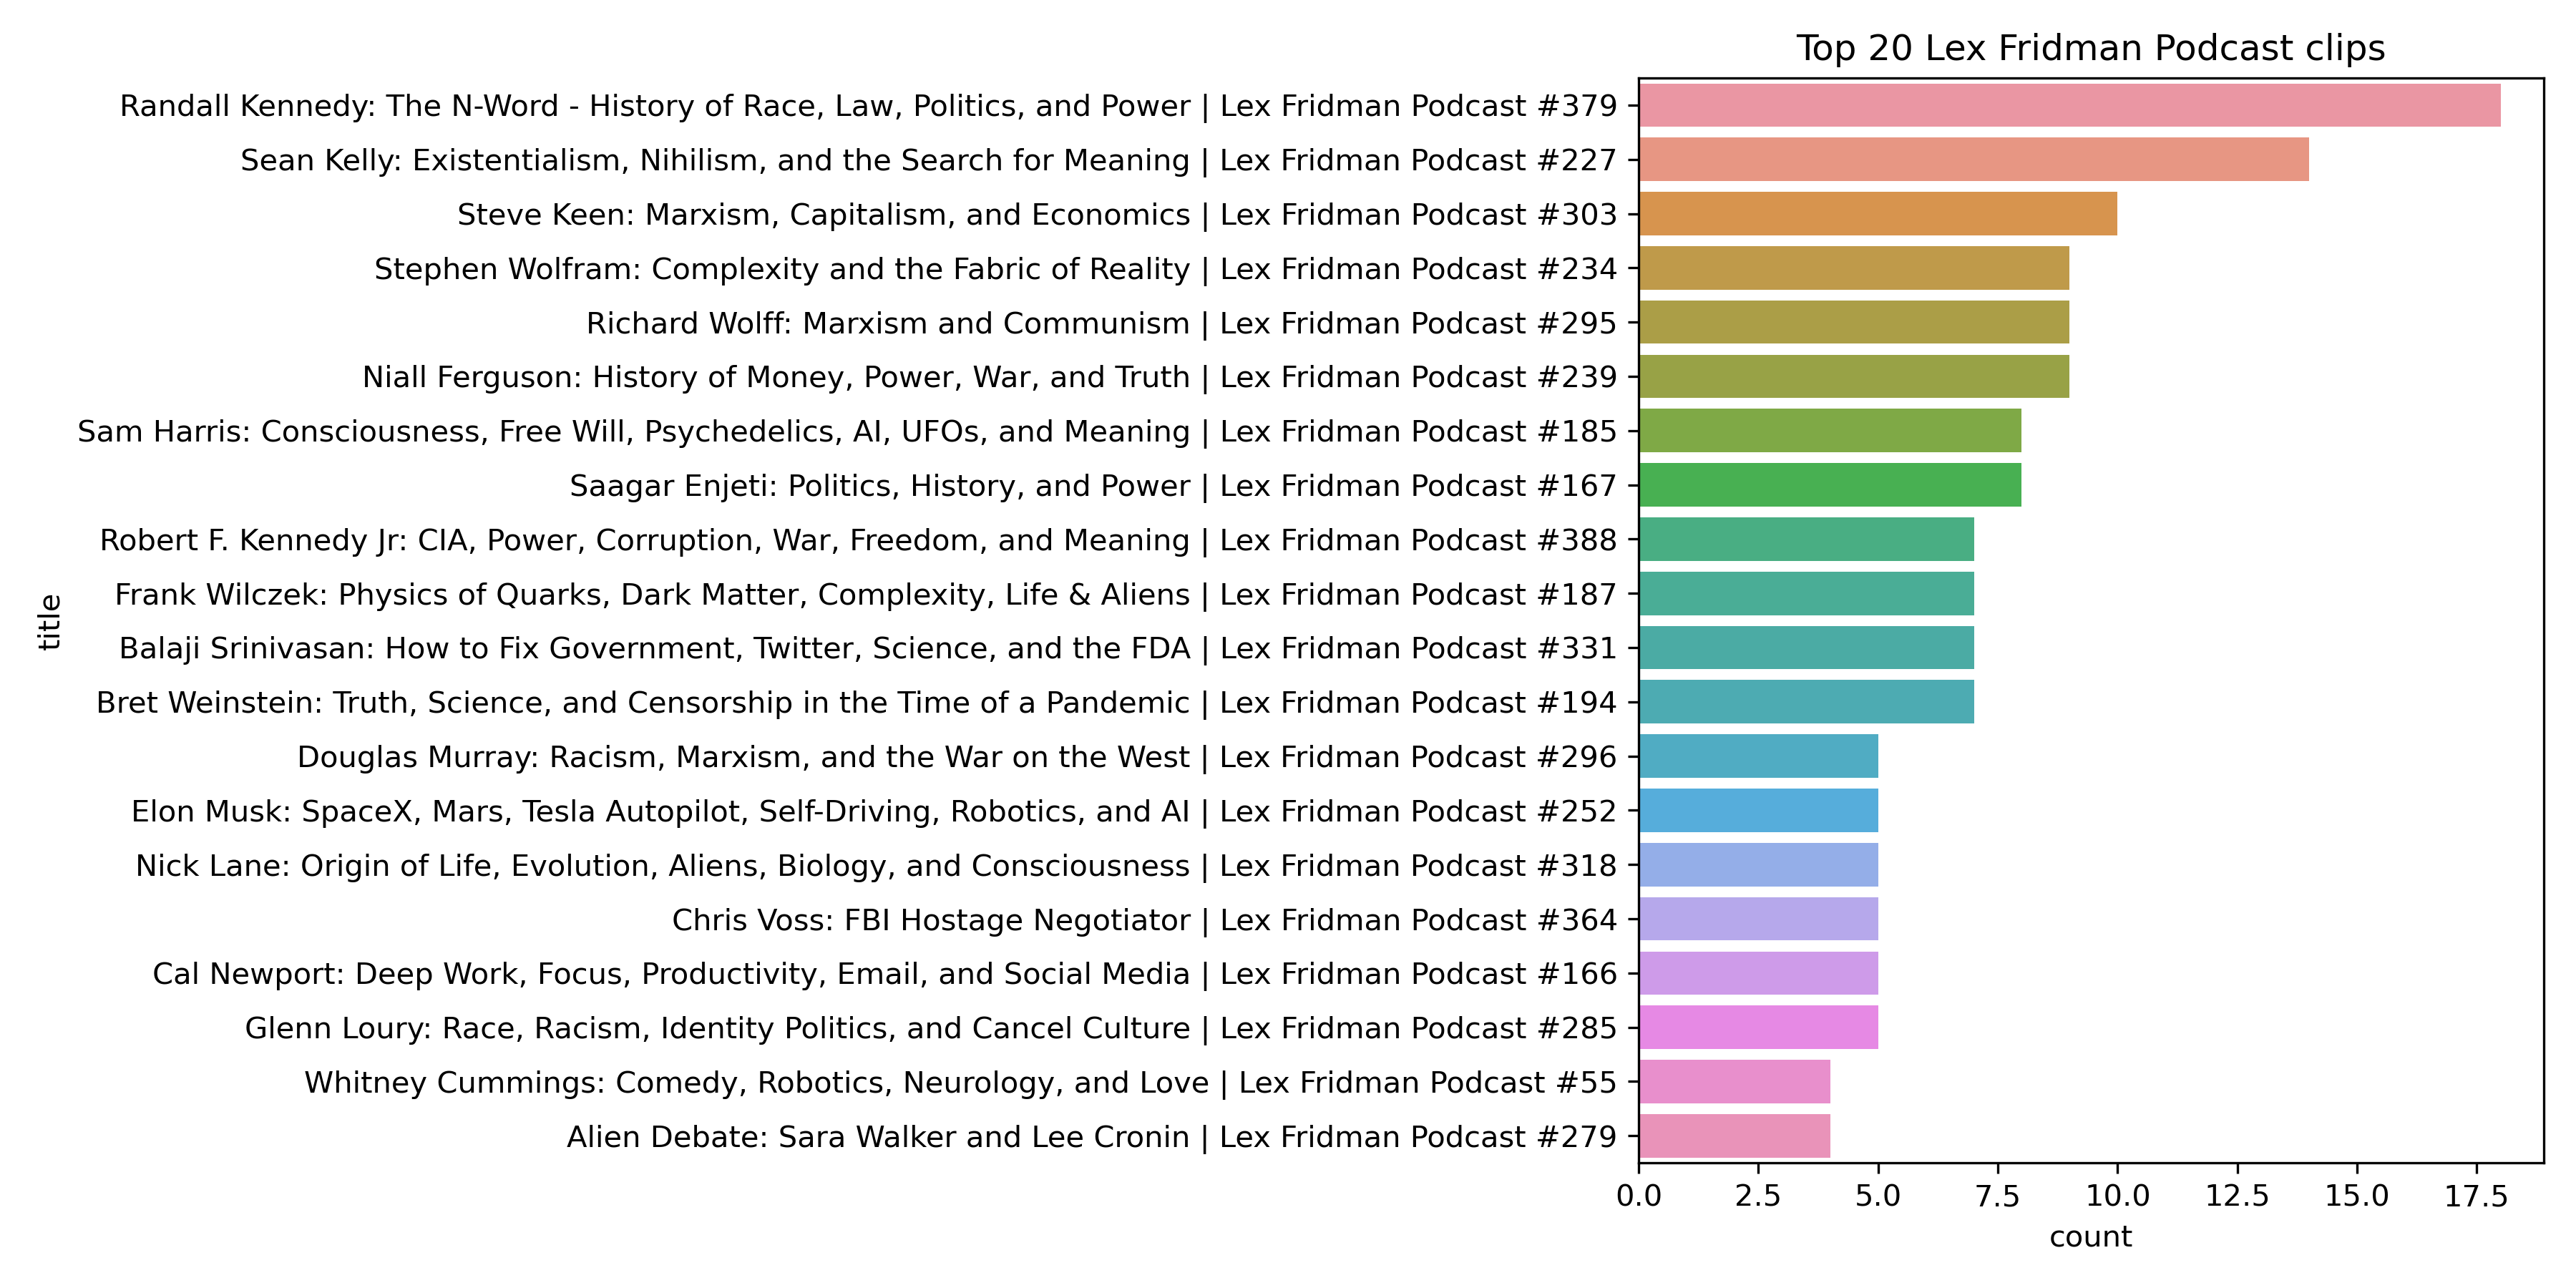
I found that I have watched around 300 clips from this podcast, most of which are full episodes.
It is also the case that I either watch an episode over multiple days, or come back to my favorite episodes every once in a while.
With the exception of one or two names, my most listened to episodes are where the guests are master story-tellers! Steve Keen and Richard Wolff are excellent at explaining Marxism philosophically, politically and historically. Randall Kennedy, Douglas Murray, and Glenn Loury, although quite different, have a very straight-forward way of speaking on racial issues, and do so with conviction and humility. Sean Kelly and Sam Harris had great episodes here as well, although I much prefer Kelly’s educational lecturing to Harris’s. Niall Ferguson, Saagar Enjeti, Robert F. Kennedy Jr., Balaji Srinivasan each educated me so much on political history, the current state of the world and on visions for the future. The overlap here is Bret Weinstein, that discusses the state of science, power and truth (he himself has had a great podcast called The Portal; check out episode #019 with Eric Weinstein. The most intense and fascinating podcast episode in the history of podcasts). Stephen Wolfram, Frank Wilczek, Nick Lane, Sara Walker and Lee Cronin on physics, biology and science in general. Finally, some people have lived intriguing lives and have lived to tell it. Chris Voss is one of them (and not listed here: Matthew Cox, Bill Ackman, Chamath Palihapitiya, Andrew Bustamente). These are all names that were unfamiliar to me before the podcast.
Uploaded 2023–11–20; Last updated 2024–03–02
3 Exploring the Stata Journal
This journal will always be special to me because it has my first peer-reviewed paper. As an homage, I scraped data on the article title, volume, issue, and author names.
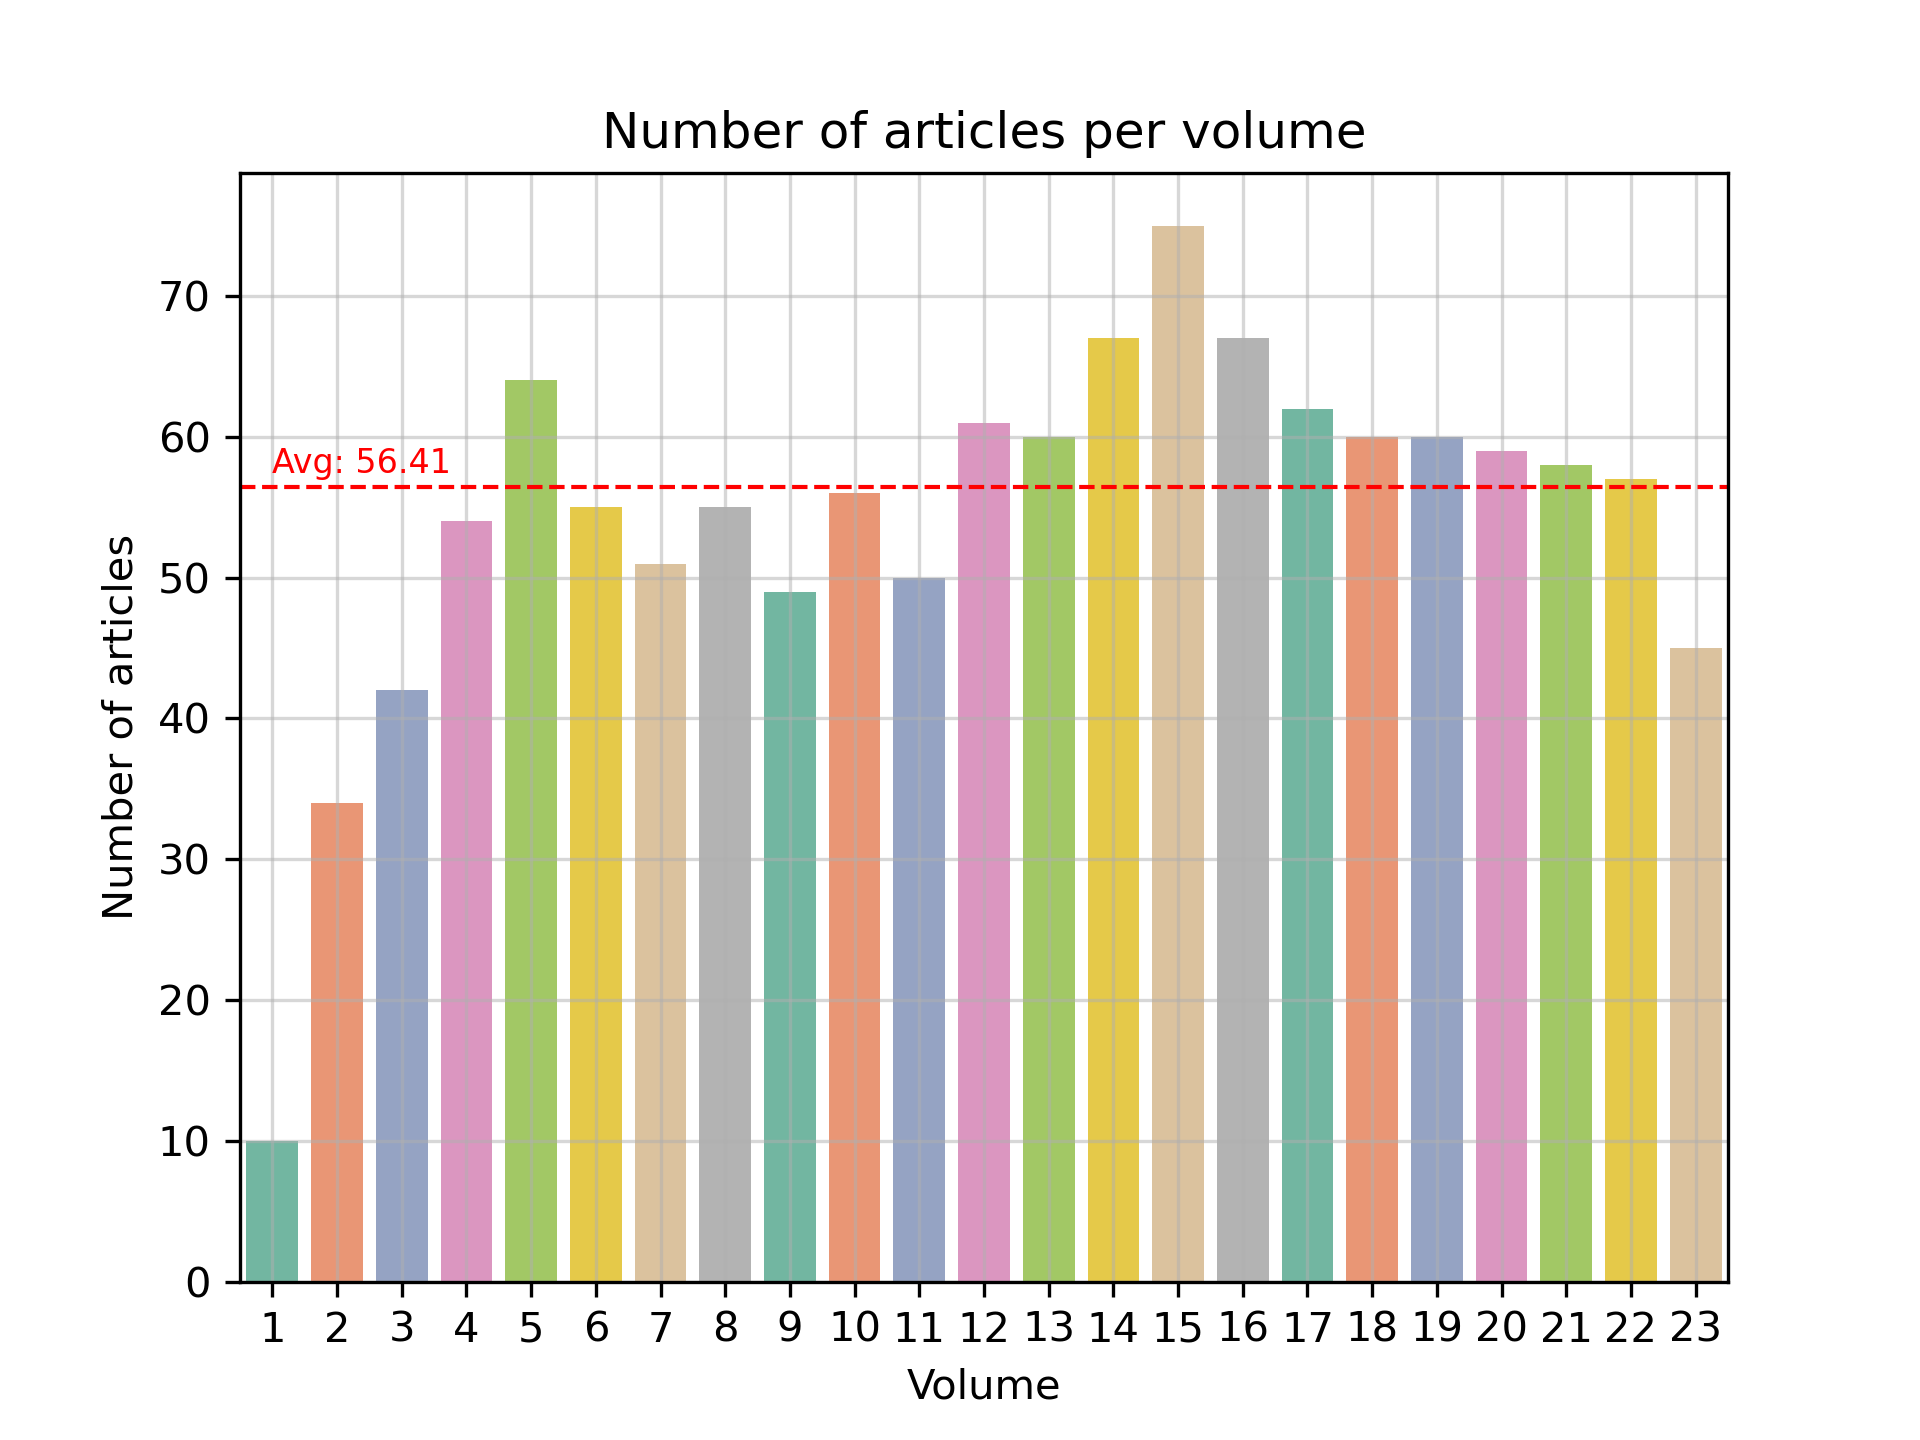
Since their start in 2001, they have published 23 volumes containing 1251 articles and 1081 unique authors.
On average, there are 56 articles per volume (or 54 if we include the incomplete volumes 1 and 23).
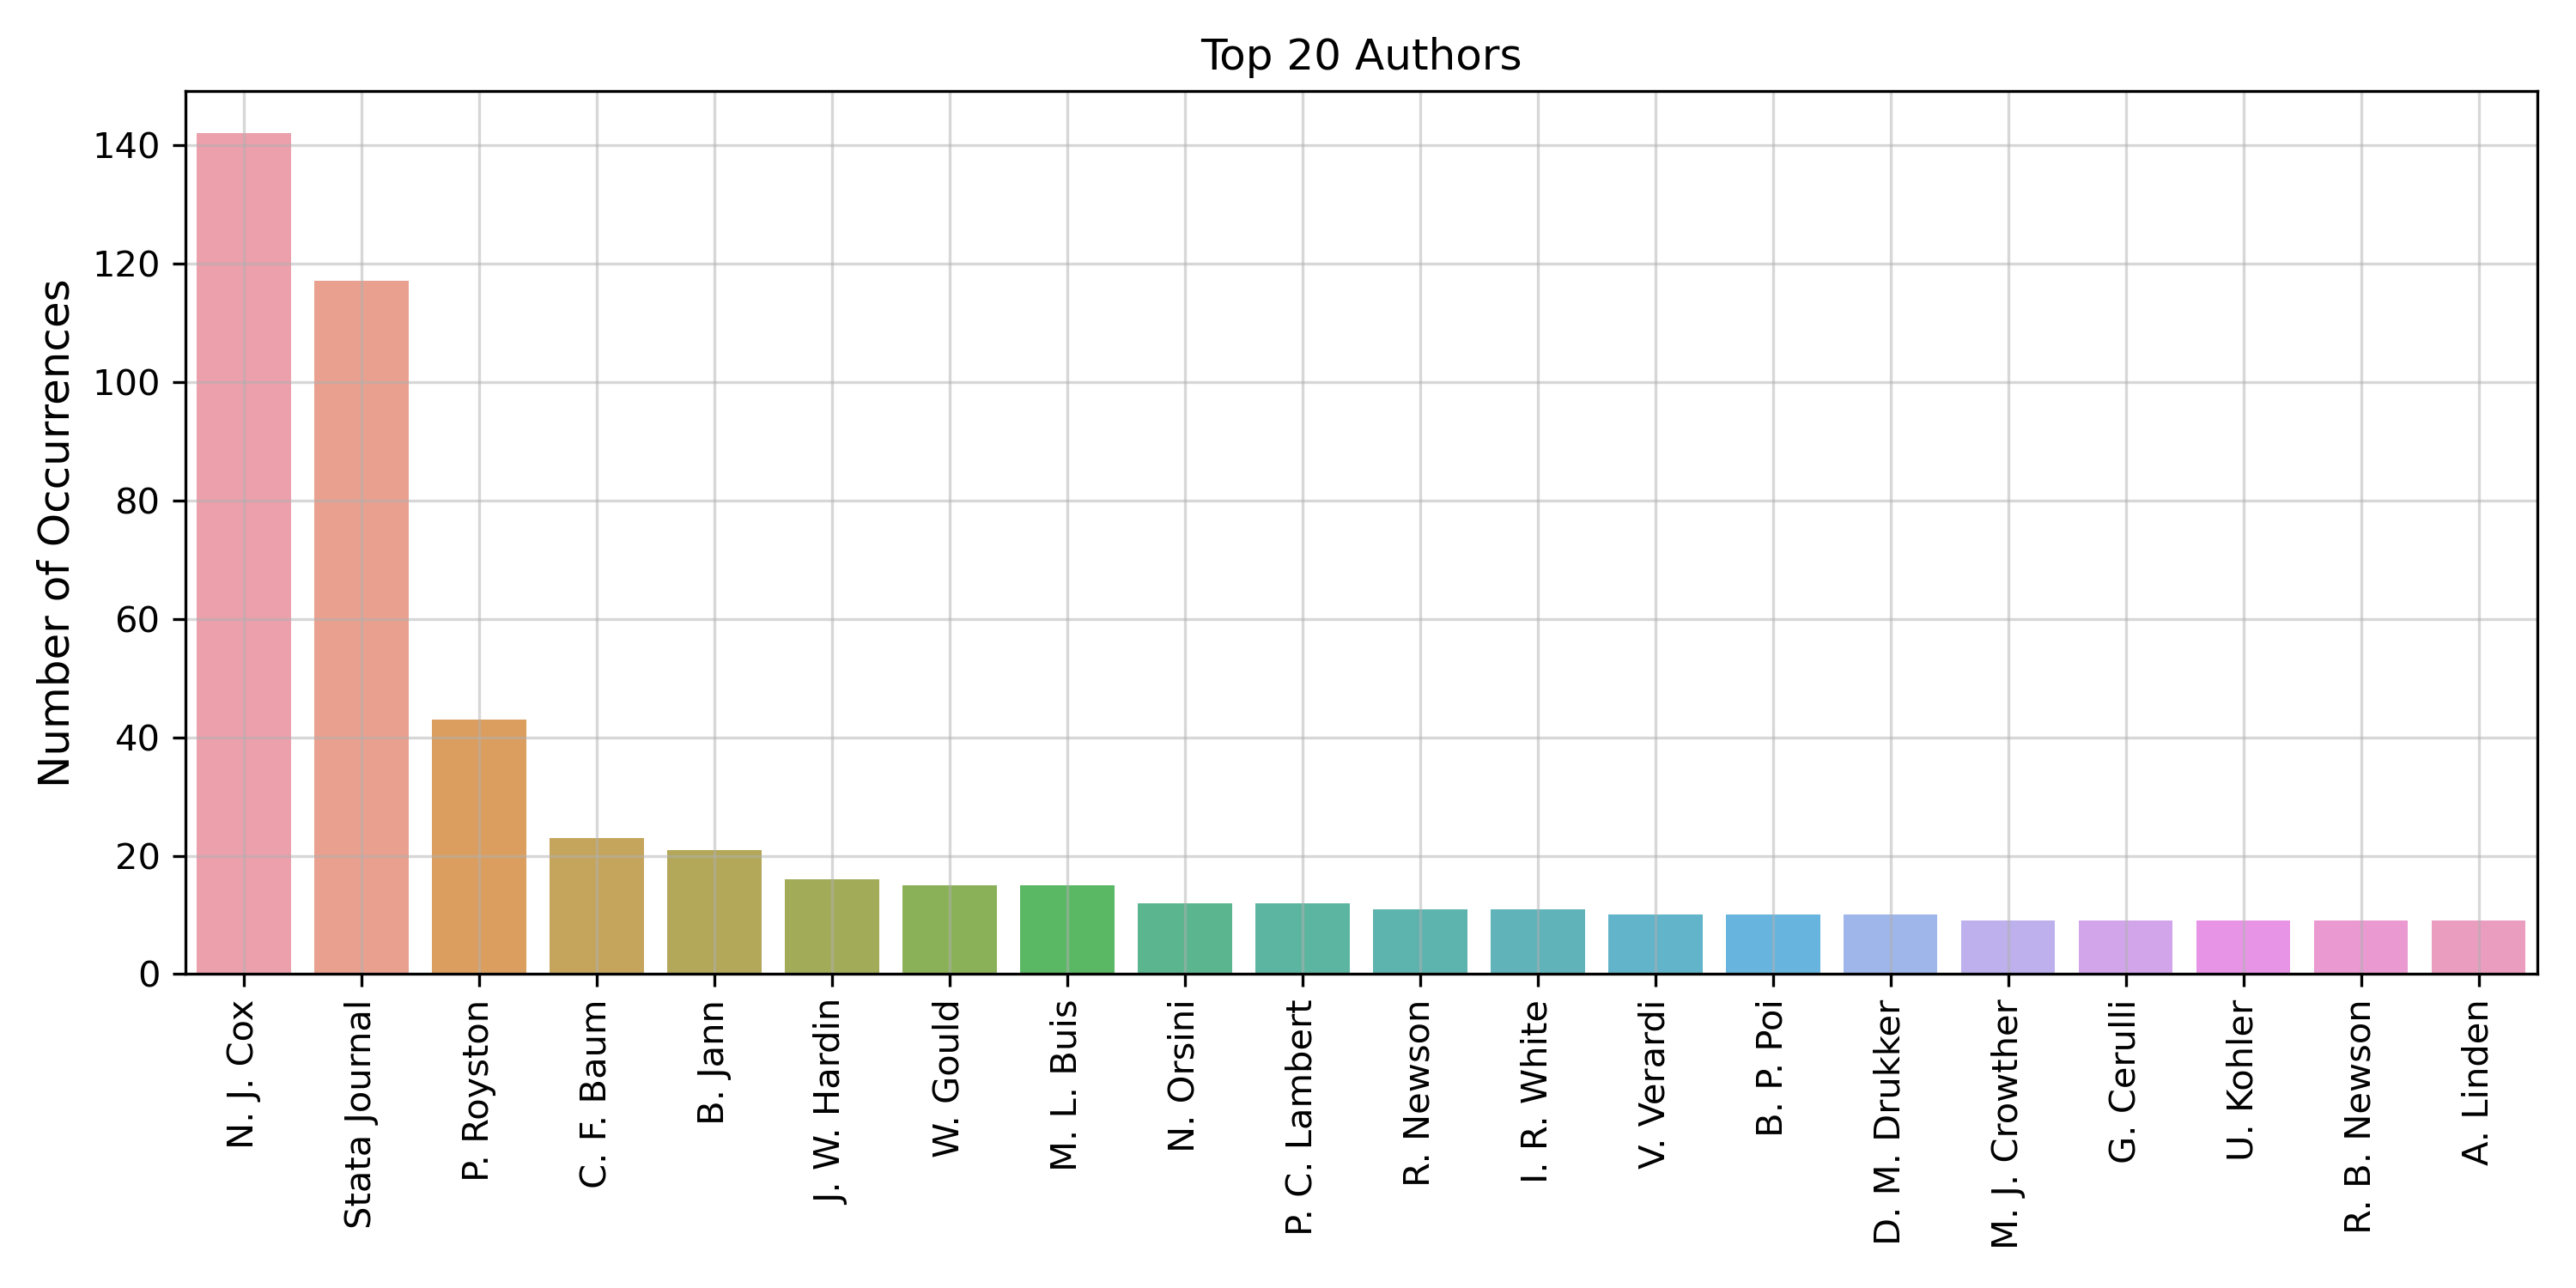
Some authors collaborate together several times, which gives us 738 unique author combinations.
Top authors (counting their appearance as single authors and co-authors) yields:
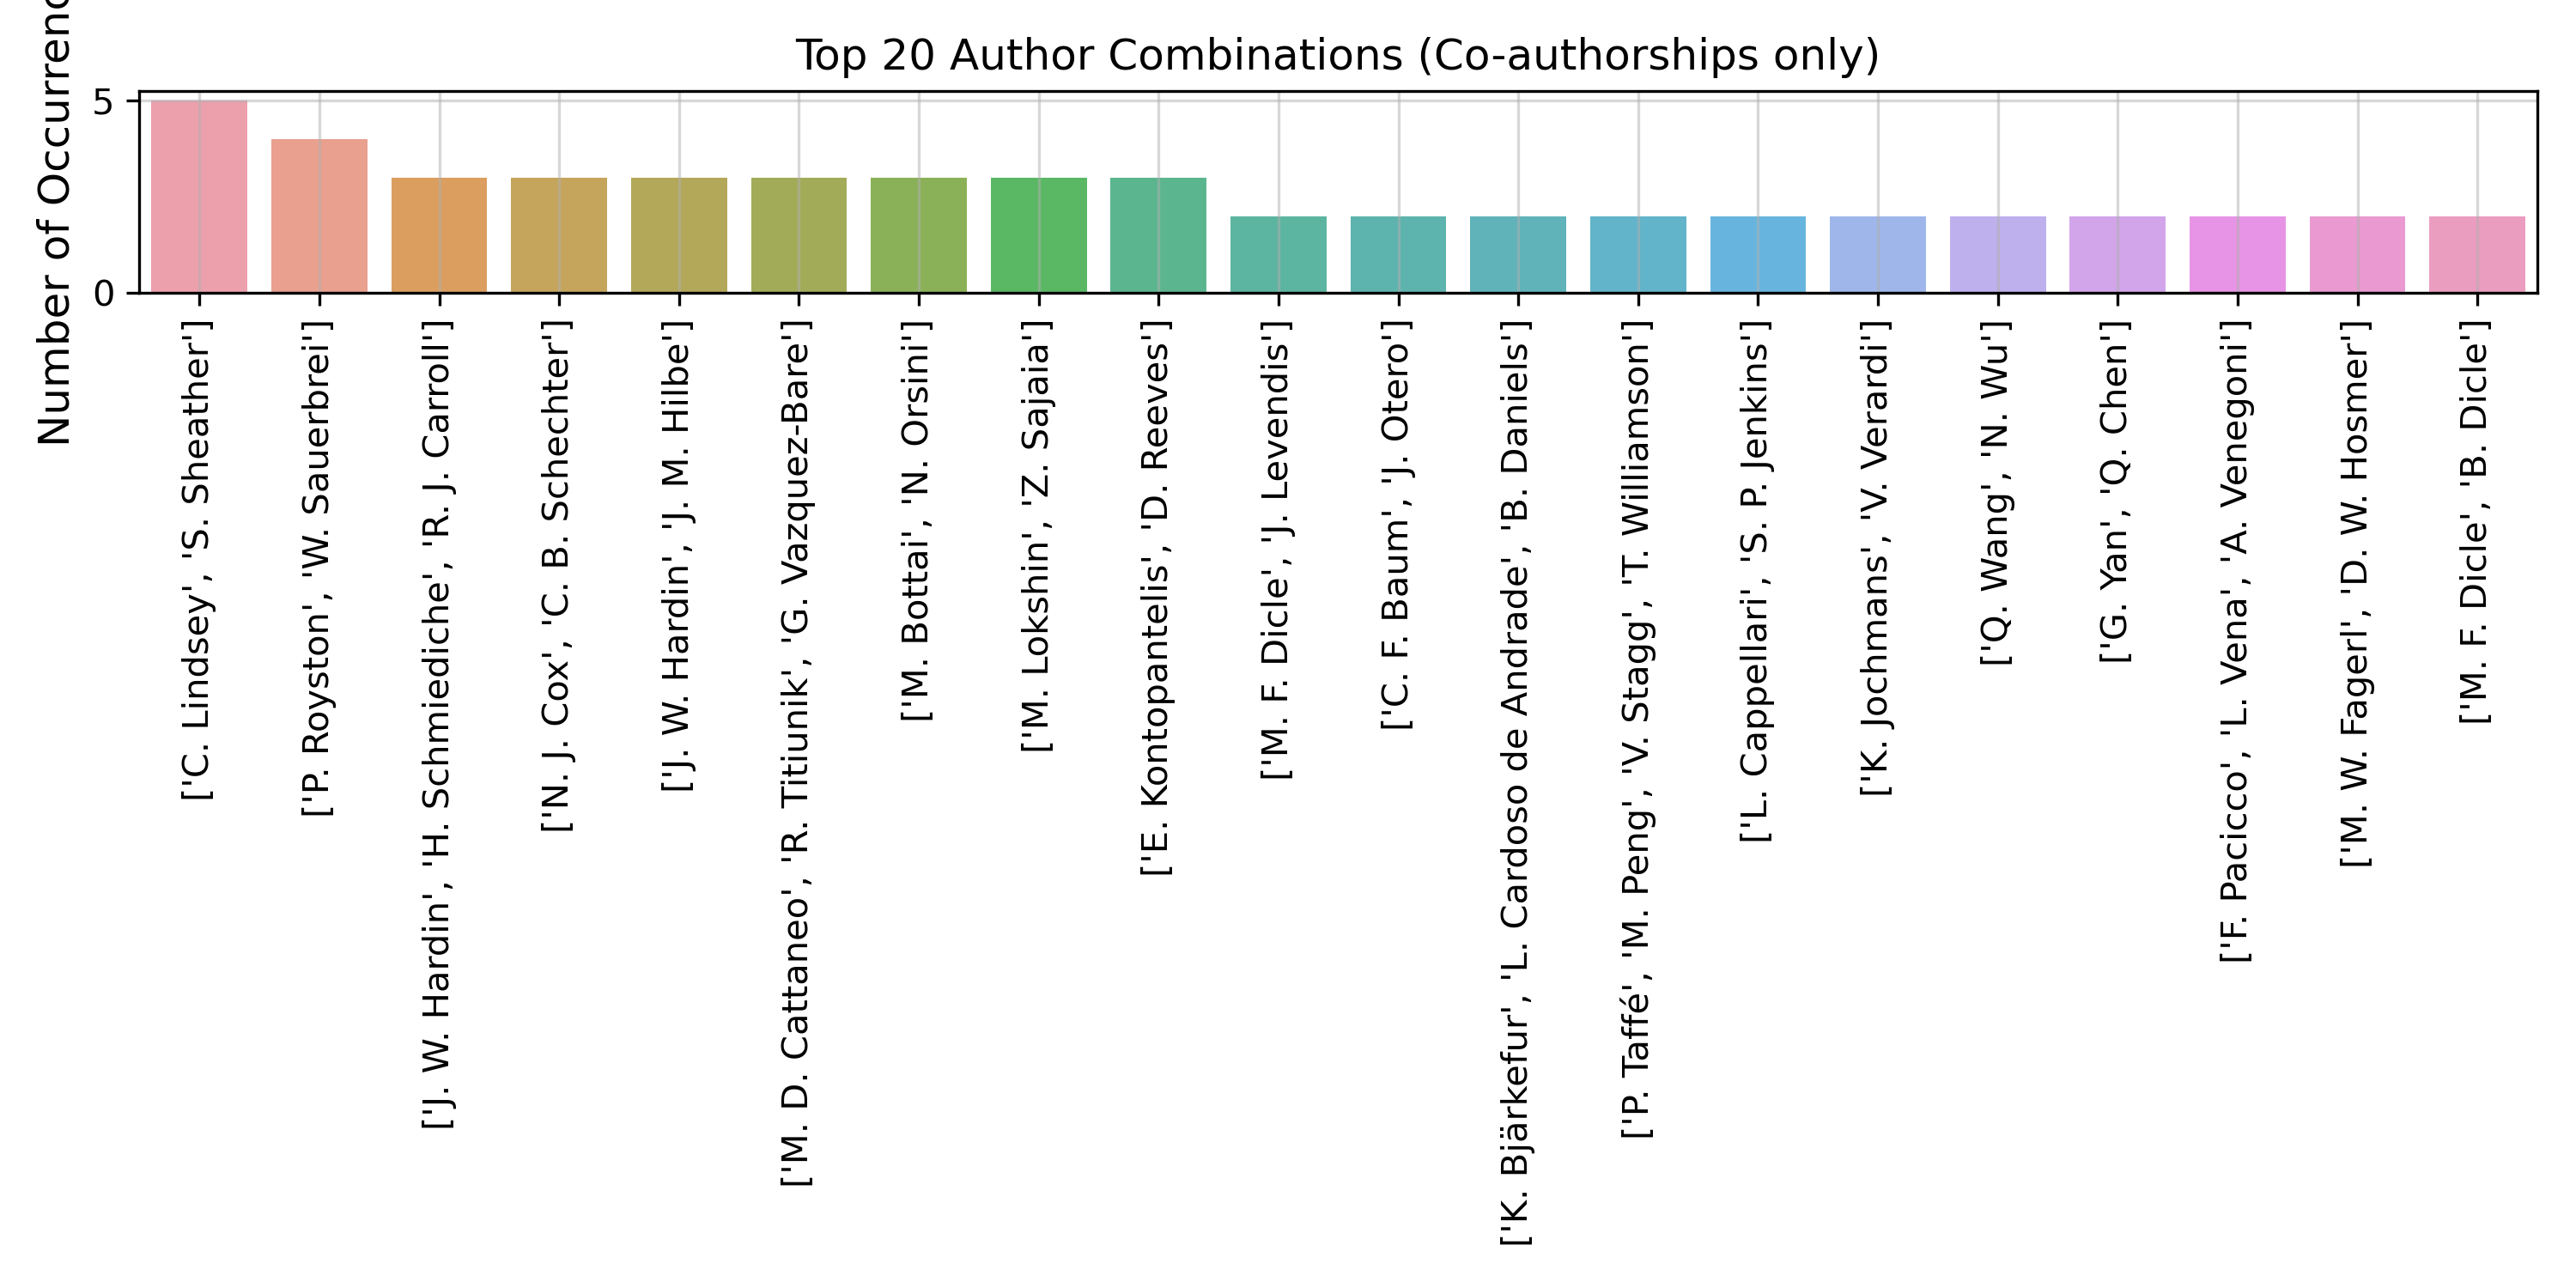
Looking only at co-authorships, the top 20 author collaborations are:
Co-authorship is also quite common and has become more common over time
Finally, we can create cool collaboration networks like this one, based on code from here.
We can also explore the topics using data from Web of Science and visualize it using VOSviewer
(this was until volume 22 and I might update soon, but not today)
For example, keyword co-occurences look like this:
Using words from the abstracts, we see some clear clusters.
There’s a programming cluster (green-purple, bottom-right), statistics cluster (green-yellow, top-left),
economics/econometrics cluster (yellow, bottom-left).
Uploaded 2023–11–21; Last updated 2023–11–21
4 Exploring my Netflix
Is there any greater sign of procras… being cultured than watching good TV? If I’m not listening to music (which was 55.8k minutes so far in 2023) or watching podcasts on YouTube (like the trifecta Lex Fridman, Joe Rogan, Andrew Huberman, with a little Theo Von, Whitney Cummings, Neil DeGrasse Tyson, and Sean Carroll sprinkled on top), then I have a show or movie running in the background on Netflix.
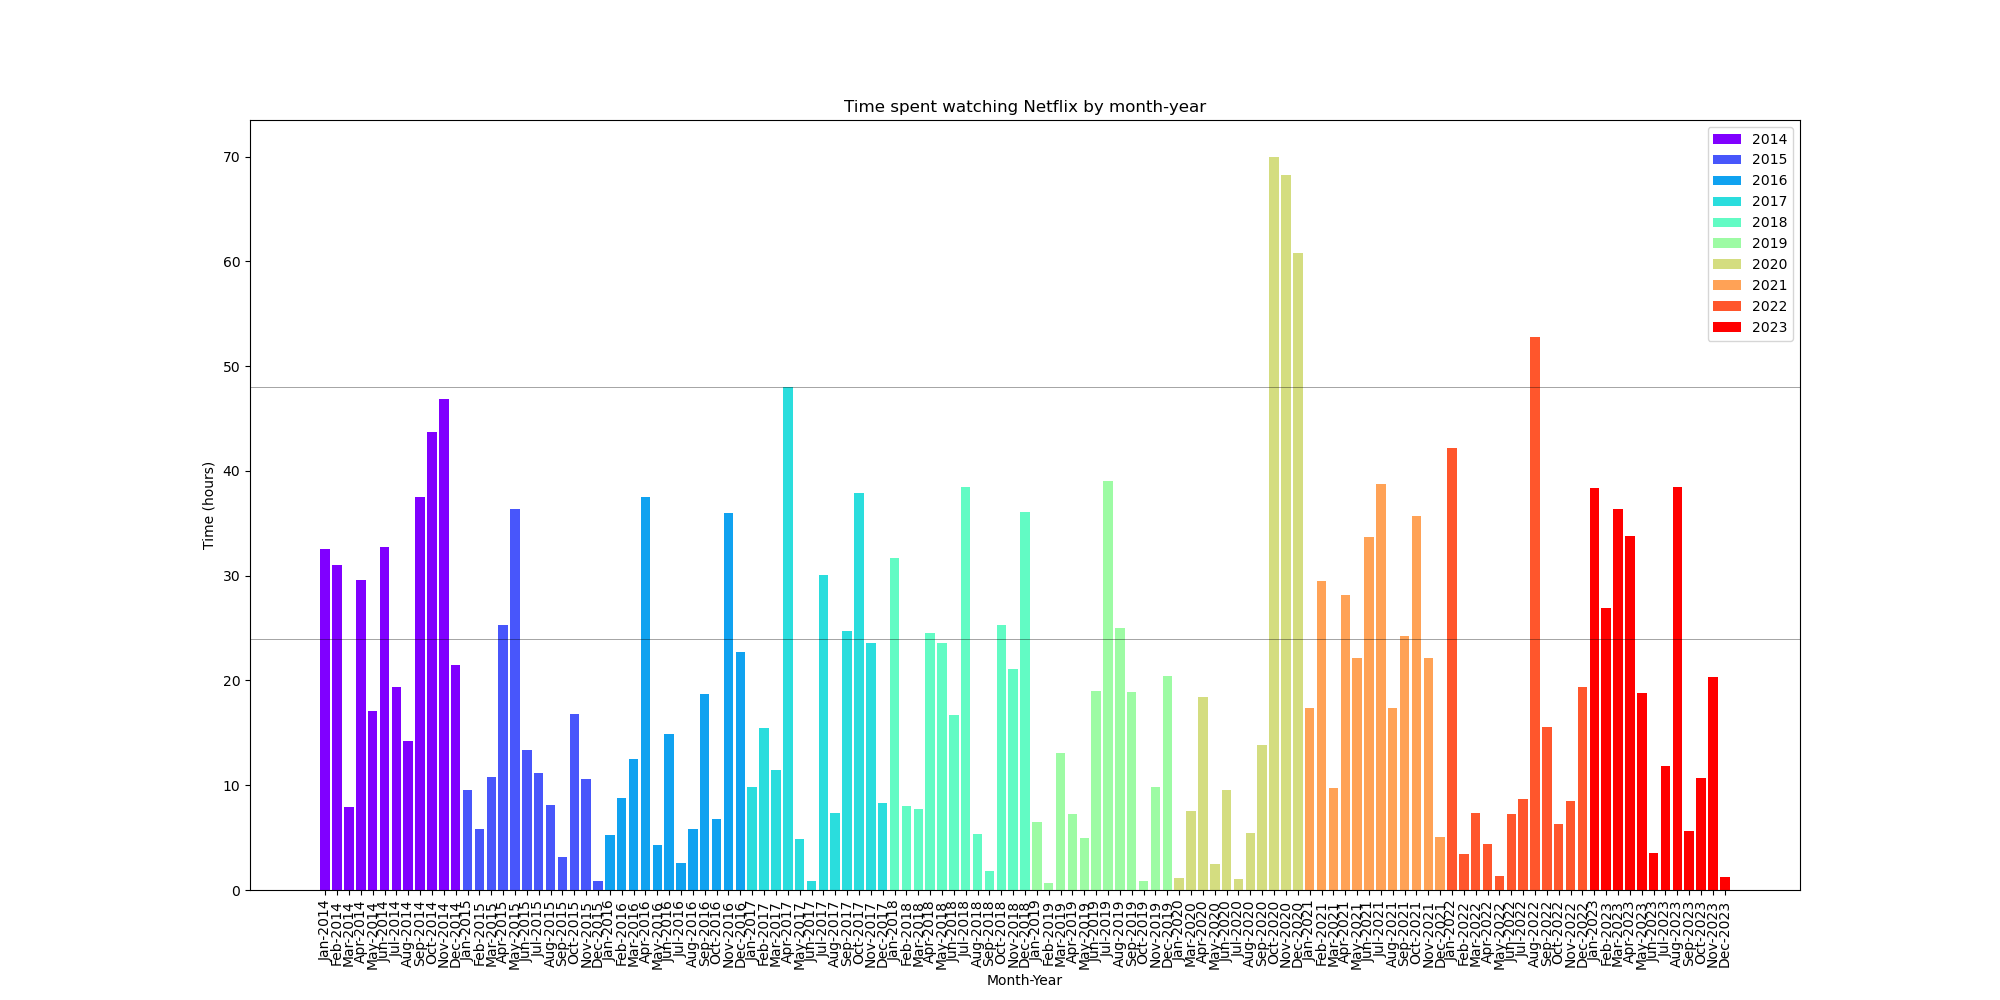
In an attempt to make this truly beautifully unnecessary statistics, I give you a summary of my Netflix viewing activity.
Surprisingly, I played outside more in the beginning of the pandemic (March–July of 2020), than I did toward the end of that year.
I seem to be getting a cold in December–February of every year, so viewing times really shoot up during that period.
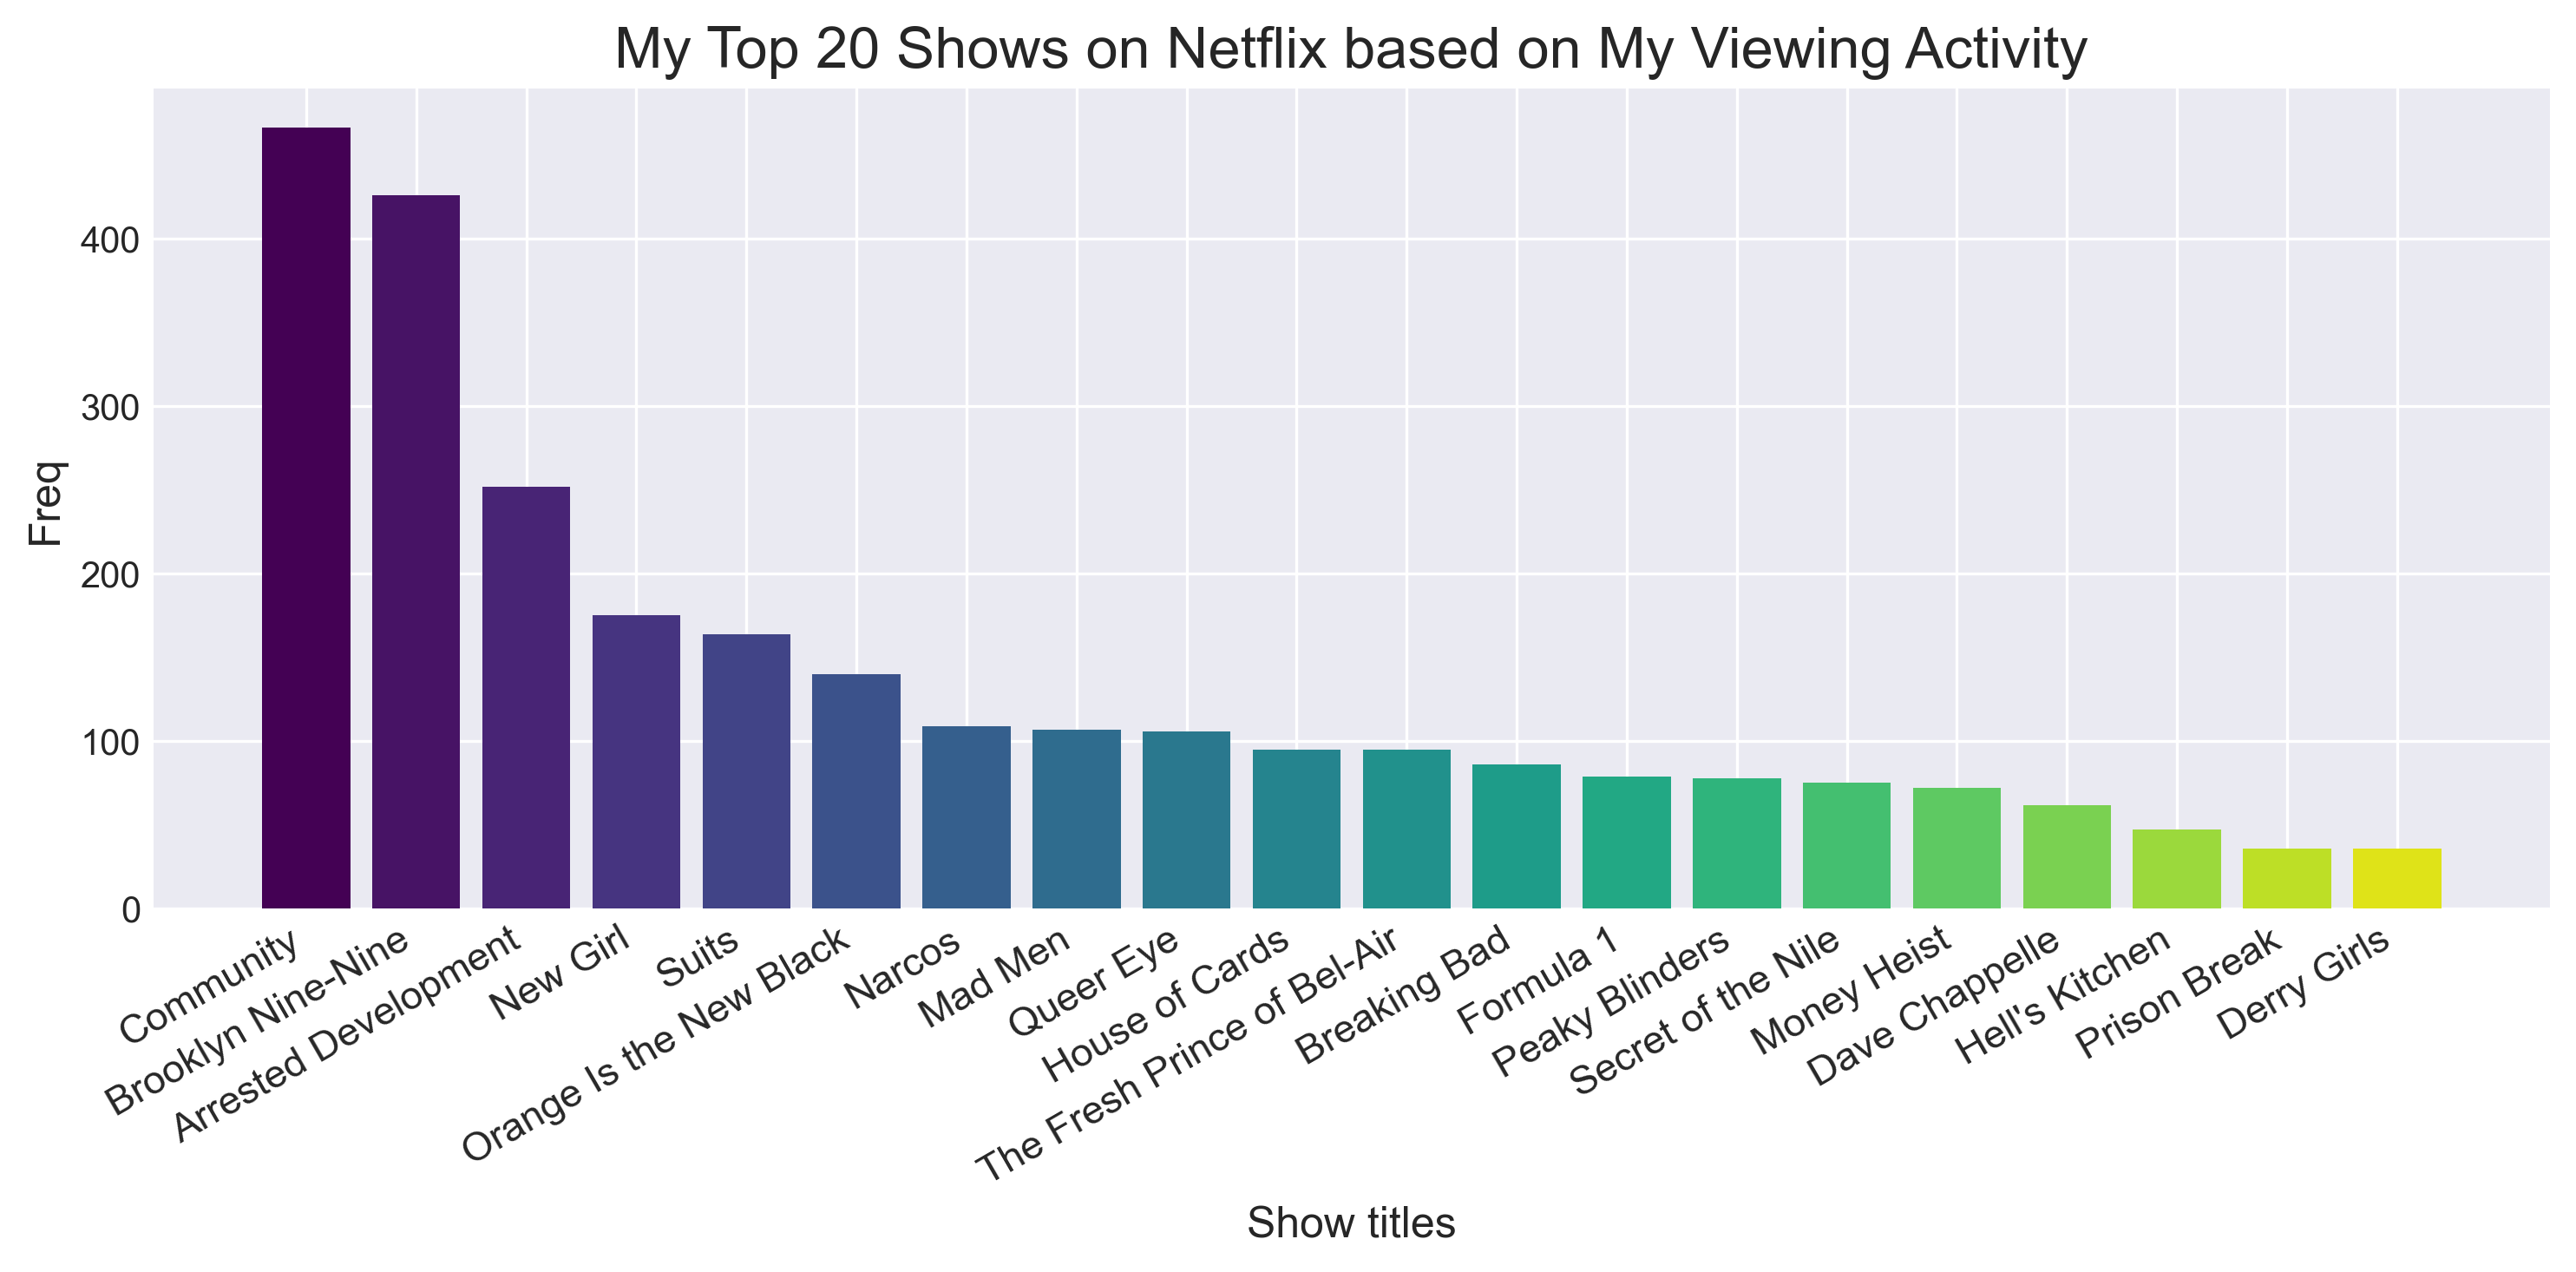
What have I watched the most? If I look at movies and series together (i.e. removing episode information from title), I get these excellent shows on my top 20.
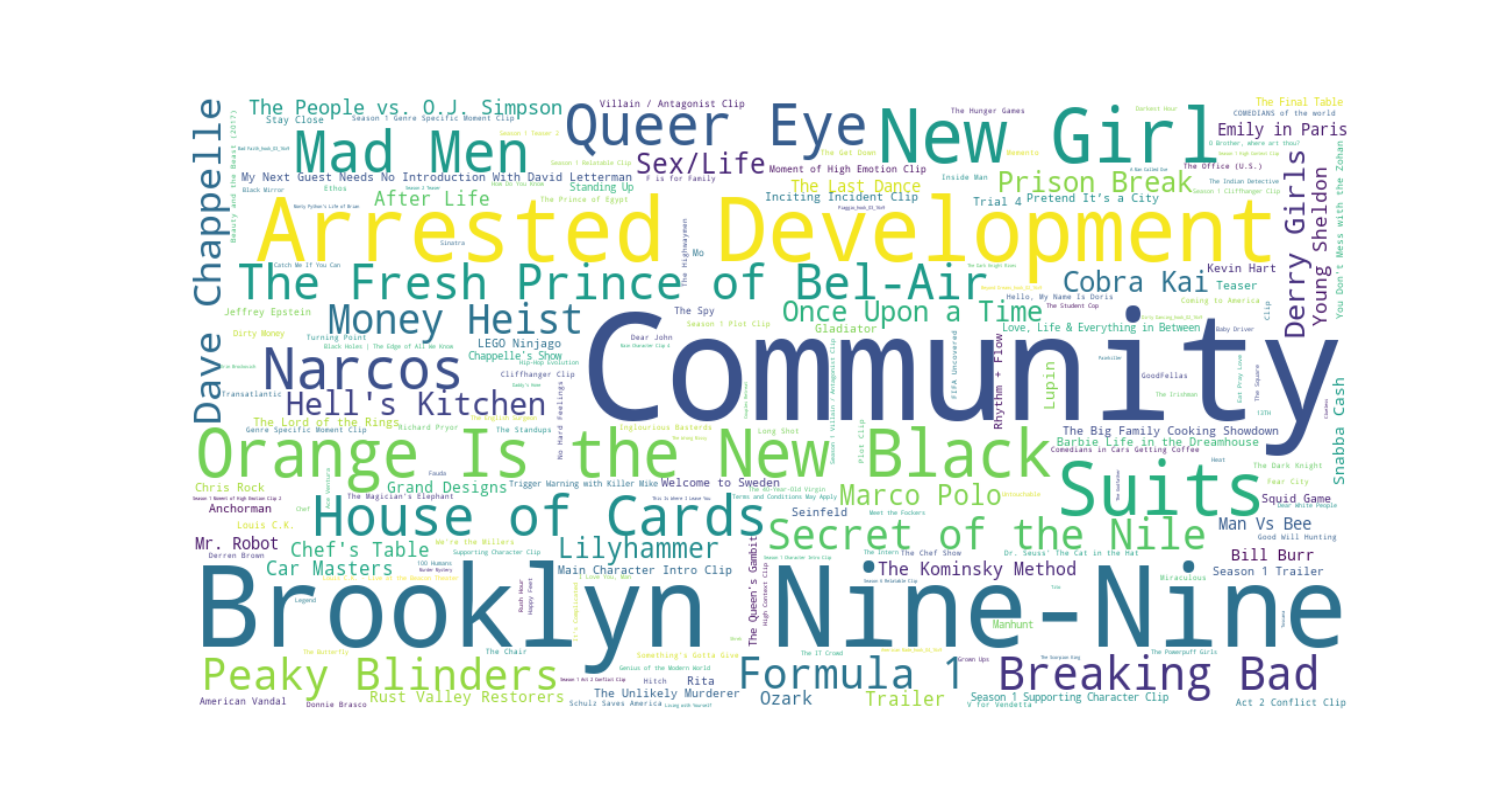
And I’ll throw in a little WordCloud while we’re at it to capture a few more titles than the top 20.
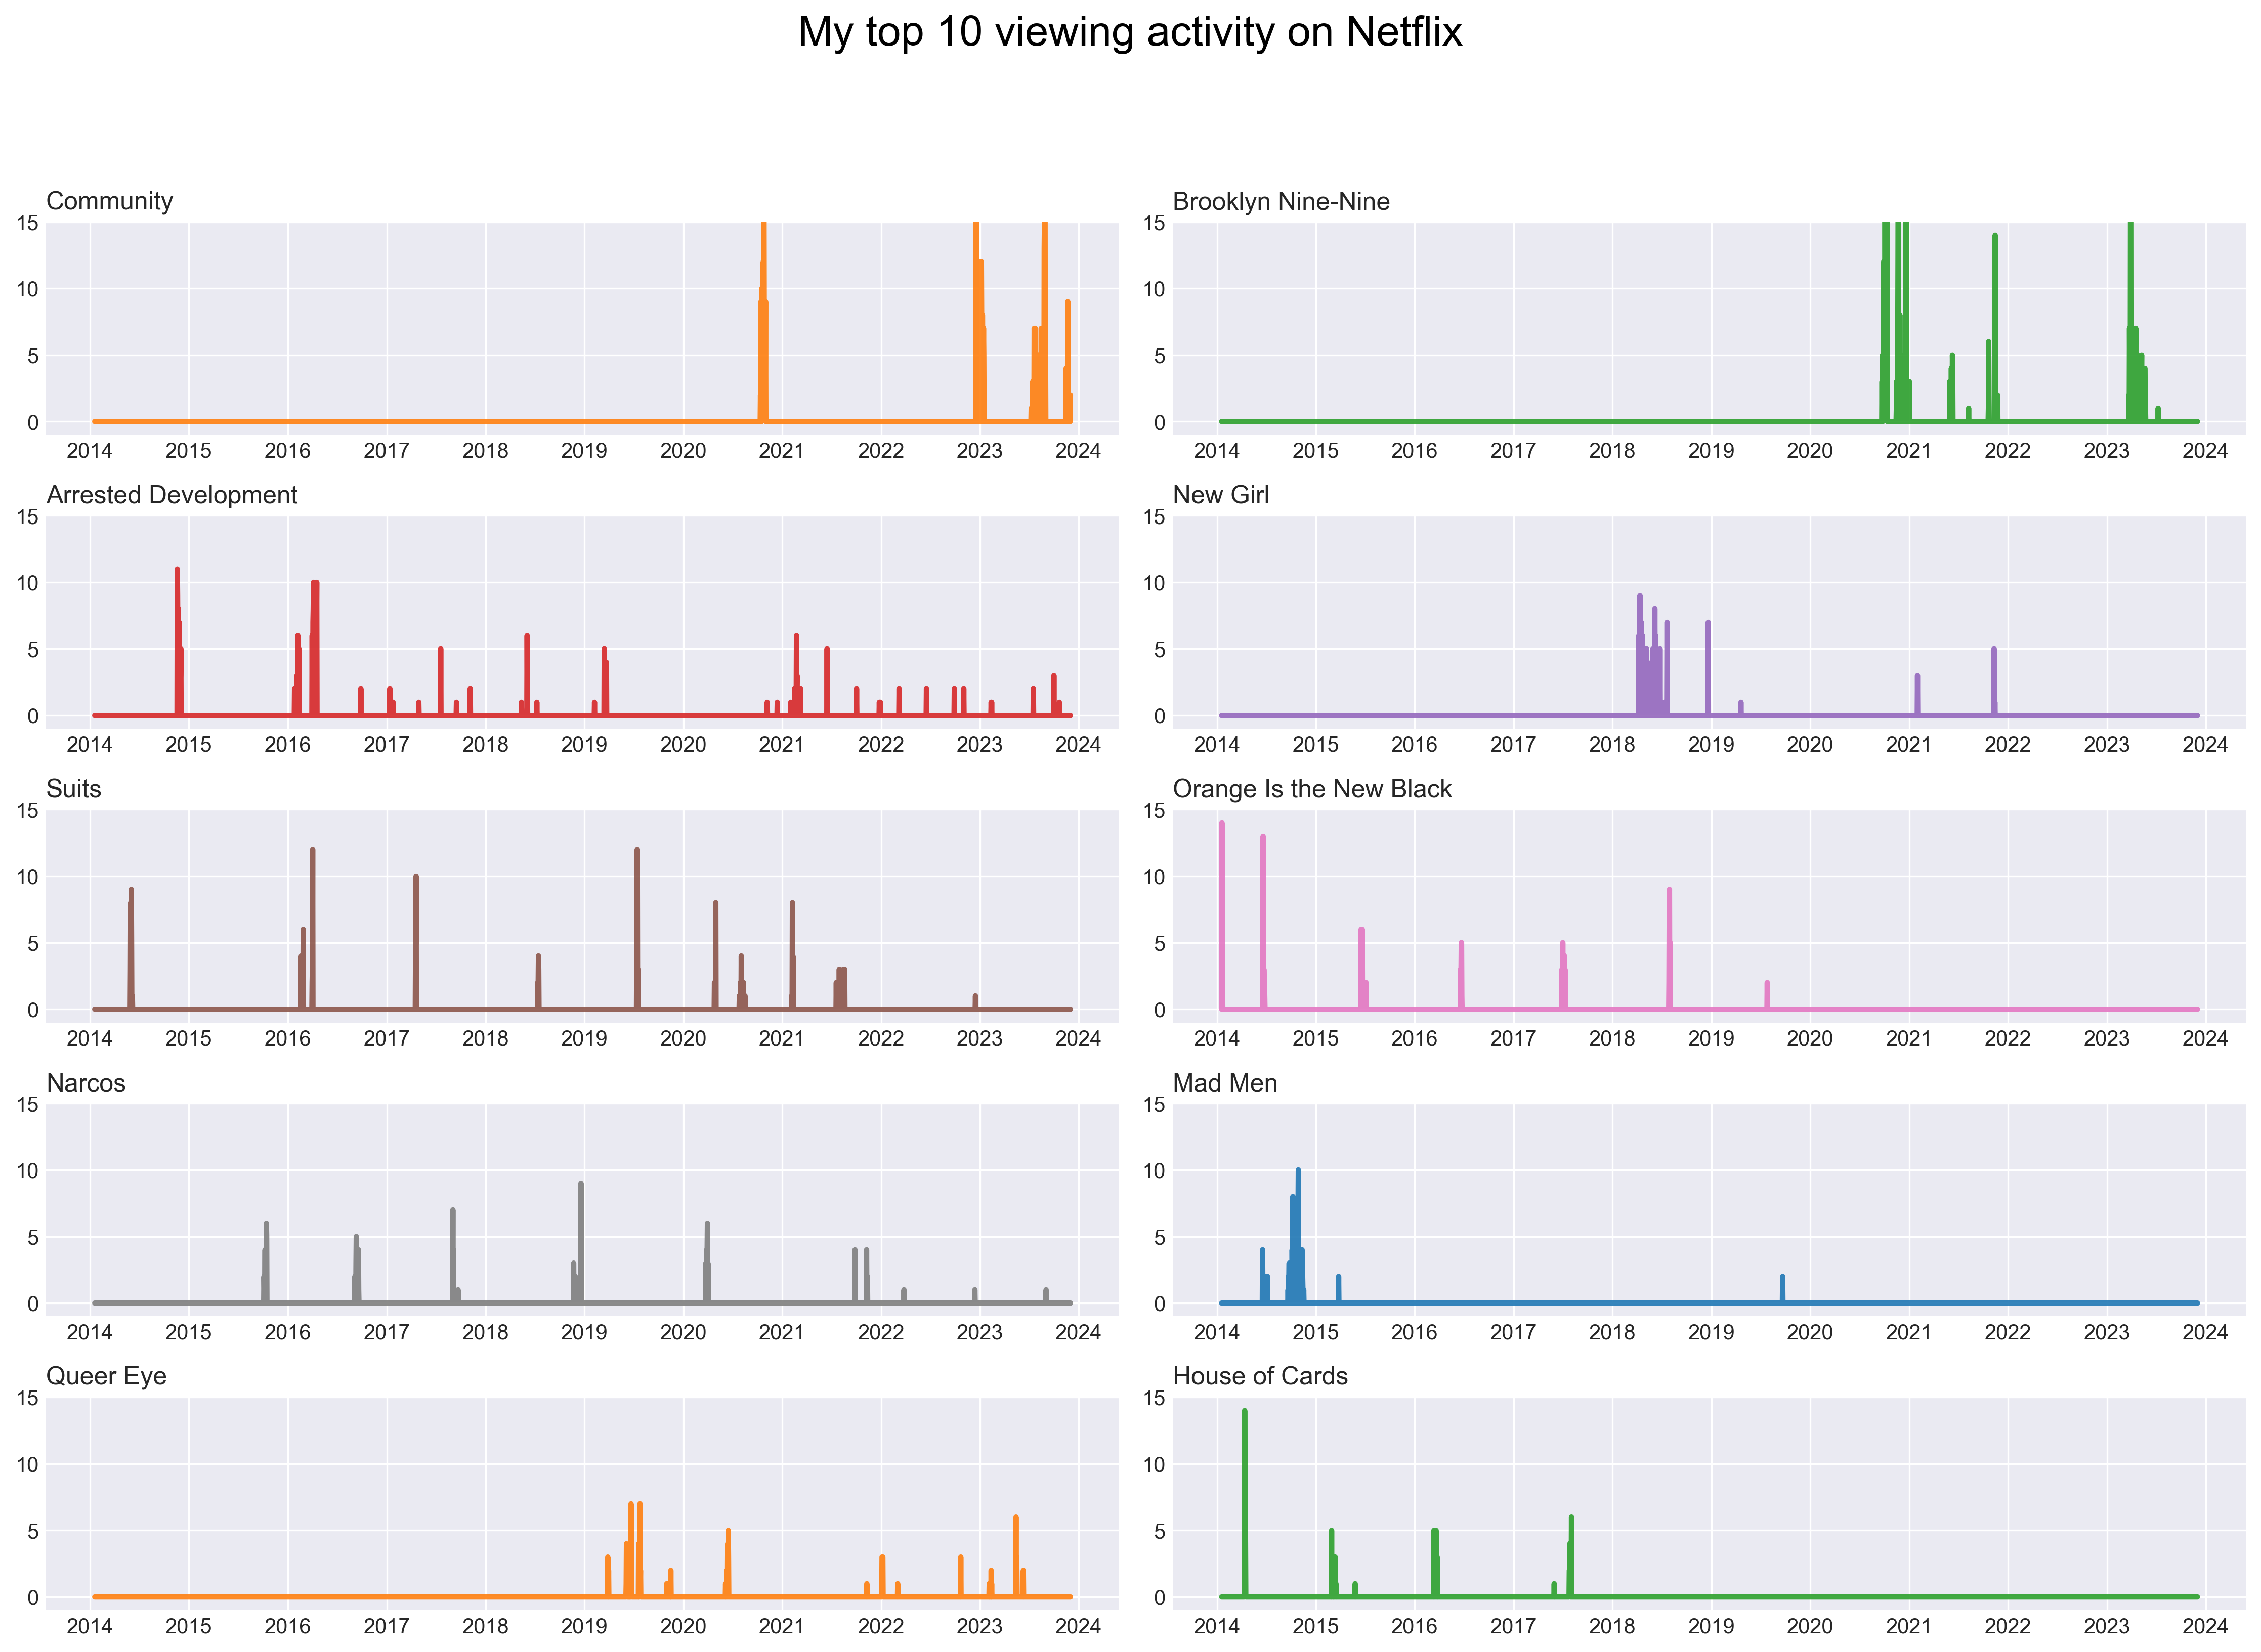
What’s more interesting is seeing when I’ve watched these series. For the top 10, you see that I’ve rewatched Community at least 3 times, and likewise had 3–4 bursts of viewing B99. Arrested Development on the other hand is just always in my life. Every once in a while, I’ll rewatch the first 3 episodes. For Narcos, I watched the 3 seasons as they came out, then jumped on the Narcos Mexico series as it came out as well (starting November 2018).
If we instead let series episodes compete with movies, then this is what the top 20 looks like.
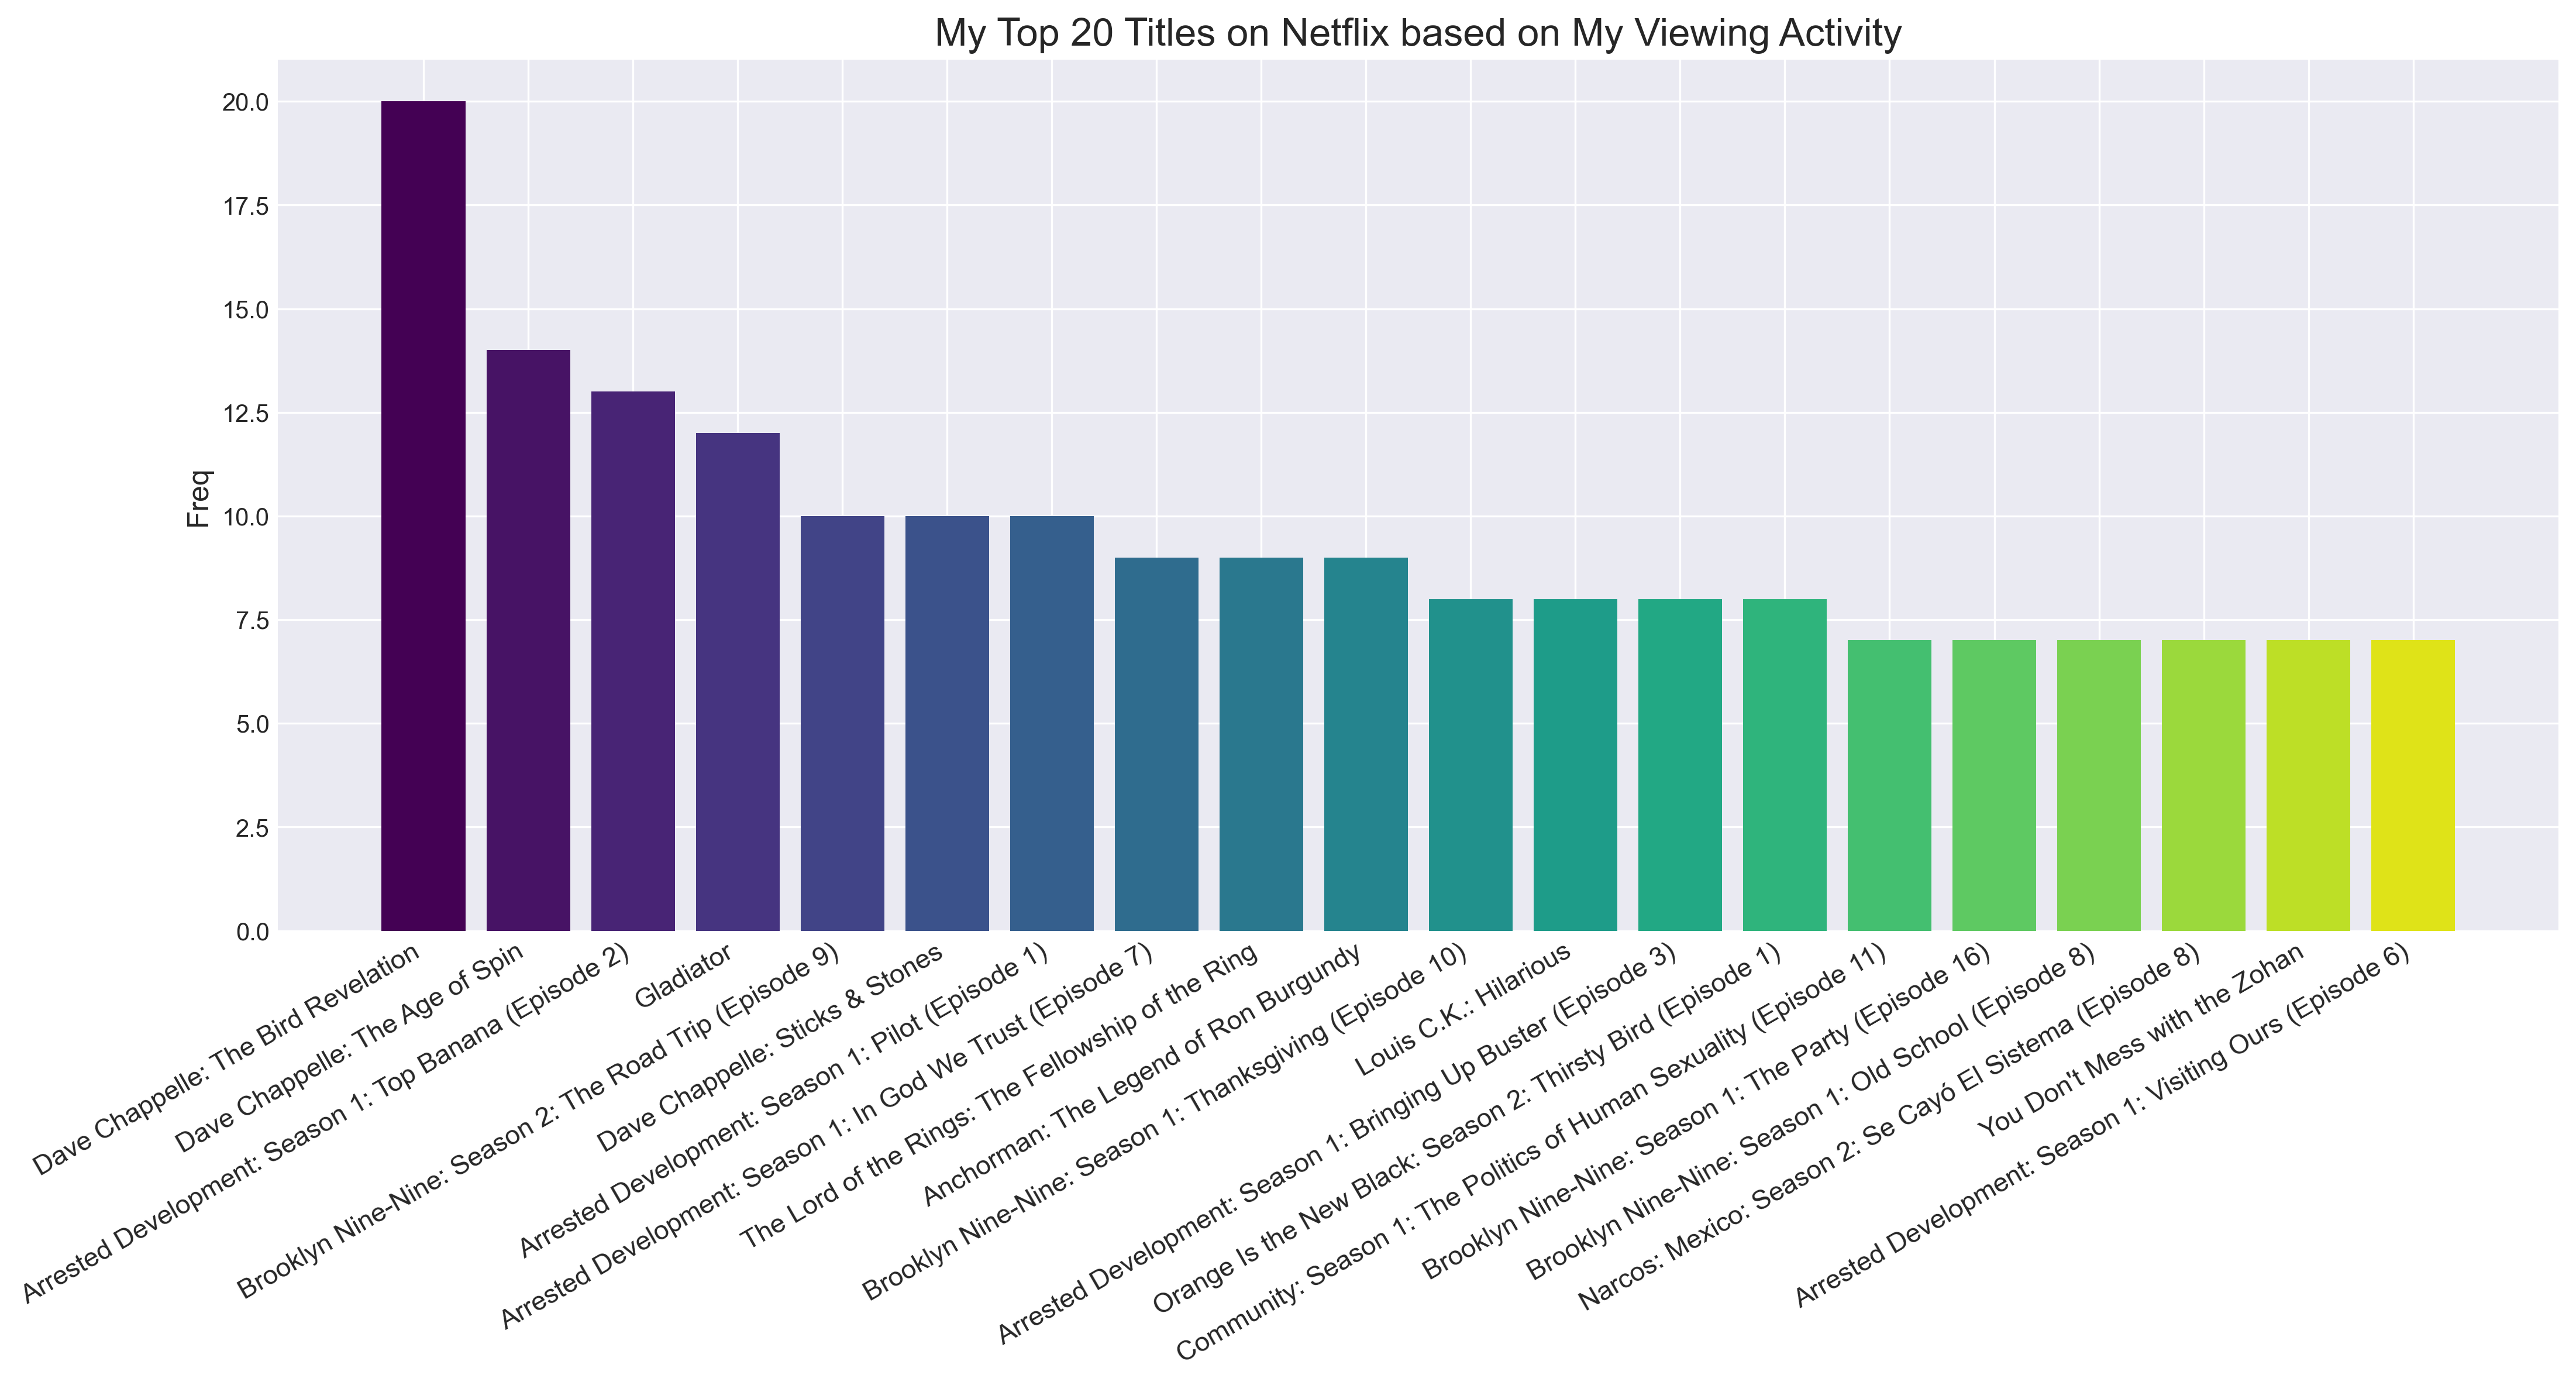
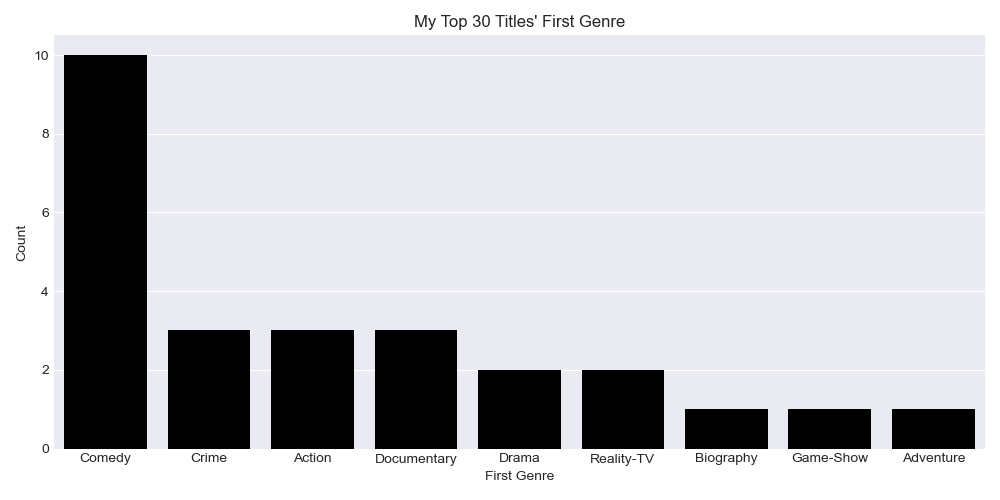
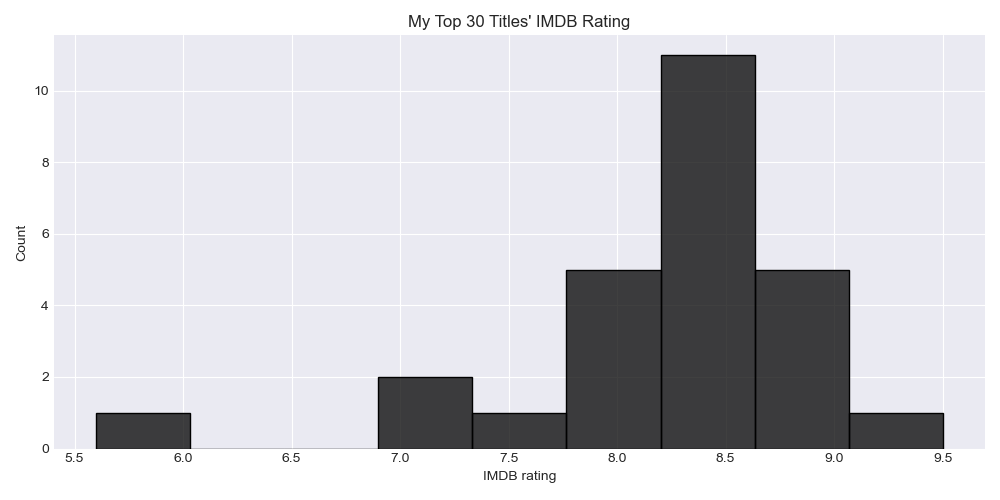
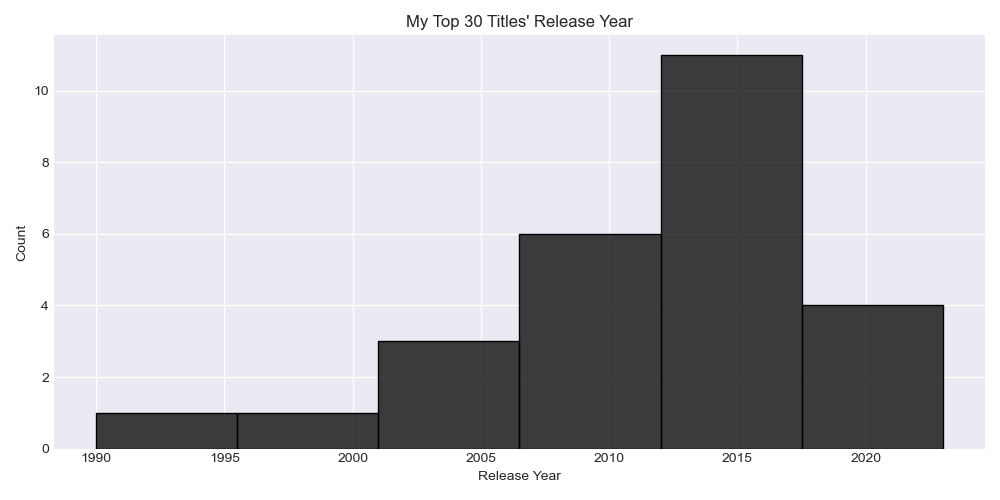
For my top 30, a quick run using the IMDB/Cinemagoer Python library, gives me the following
information on genres, ratings and release years.
One day, I may take these BUS seriously. Today is not that day. In the words of Maximus Decimus Meridius, “Are you not entertained? Is this not why you are here?”
Uploaded 2023–12–01; Last updated 2023-12-01
5 Exploring my library
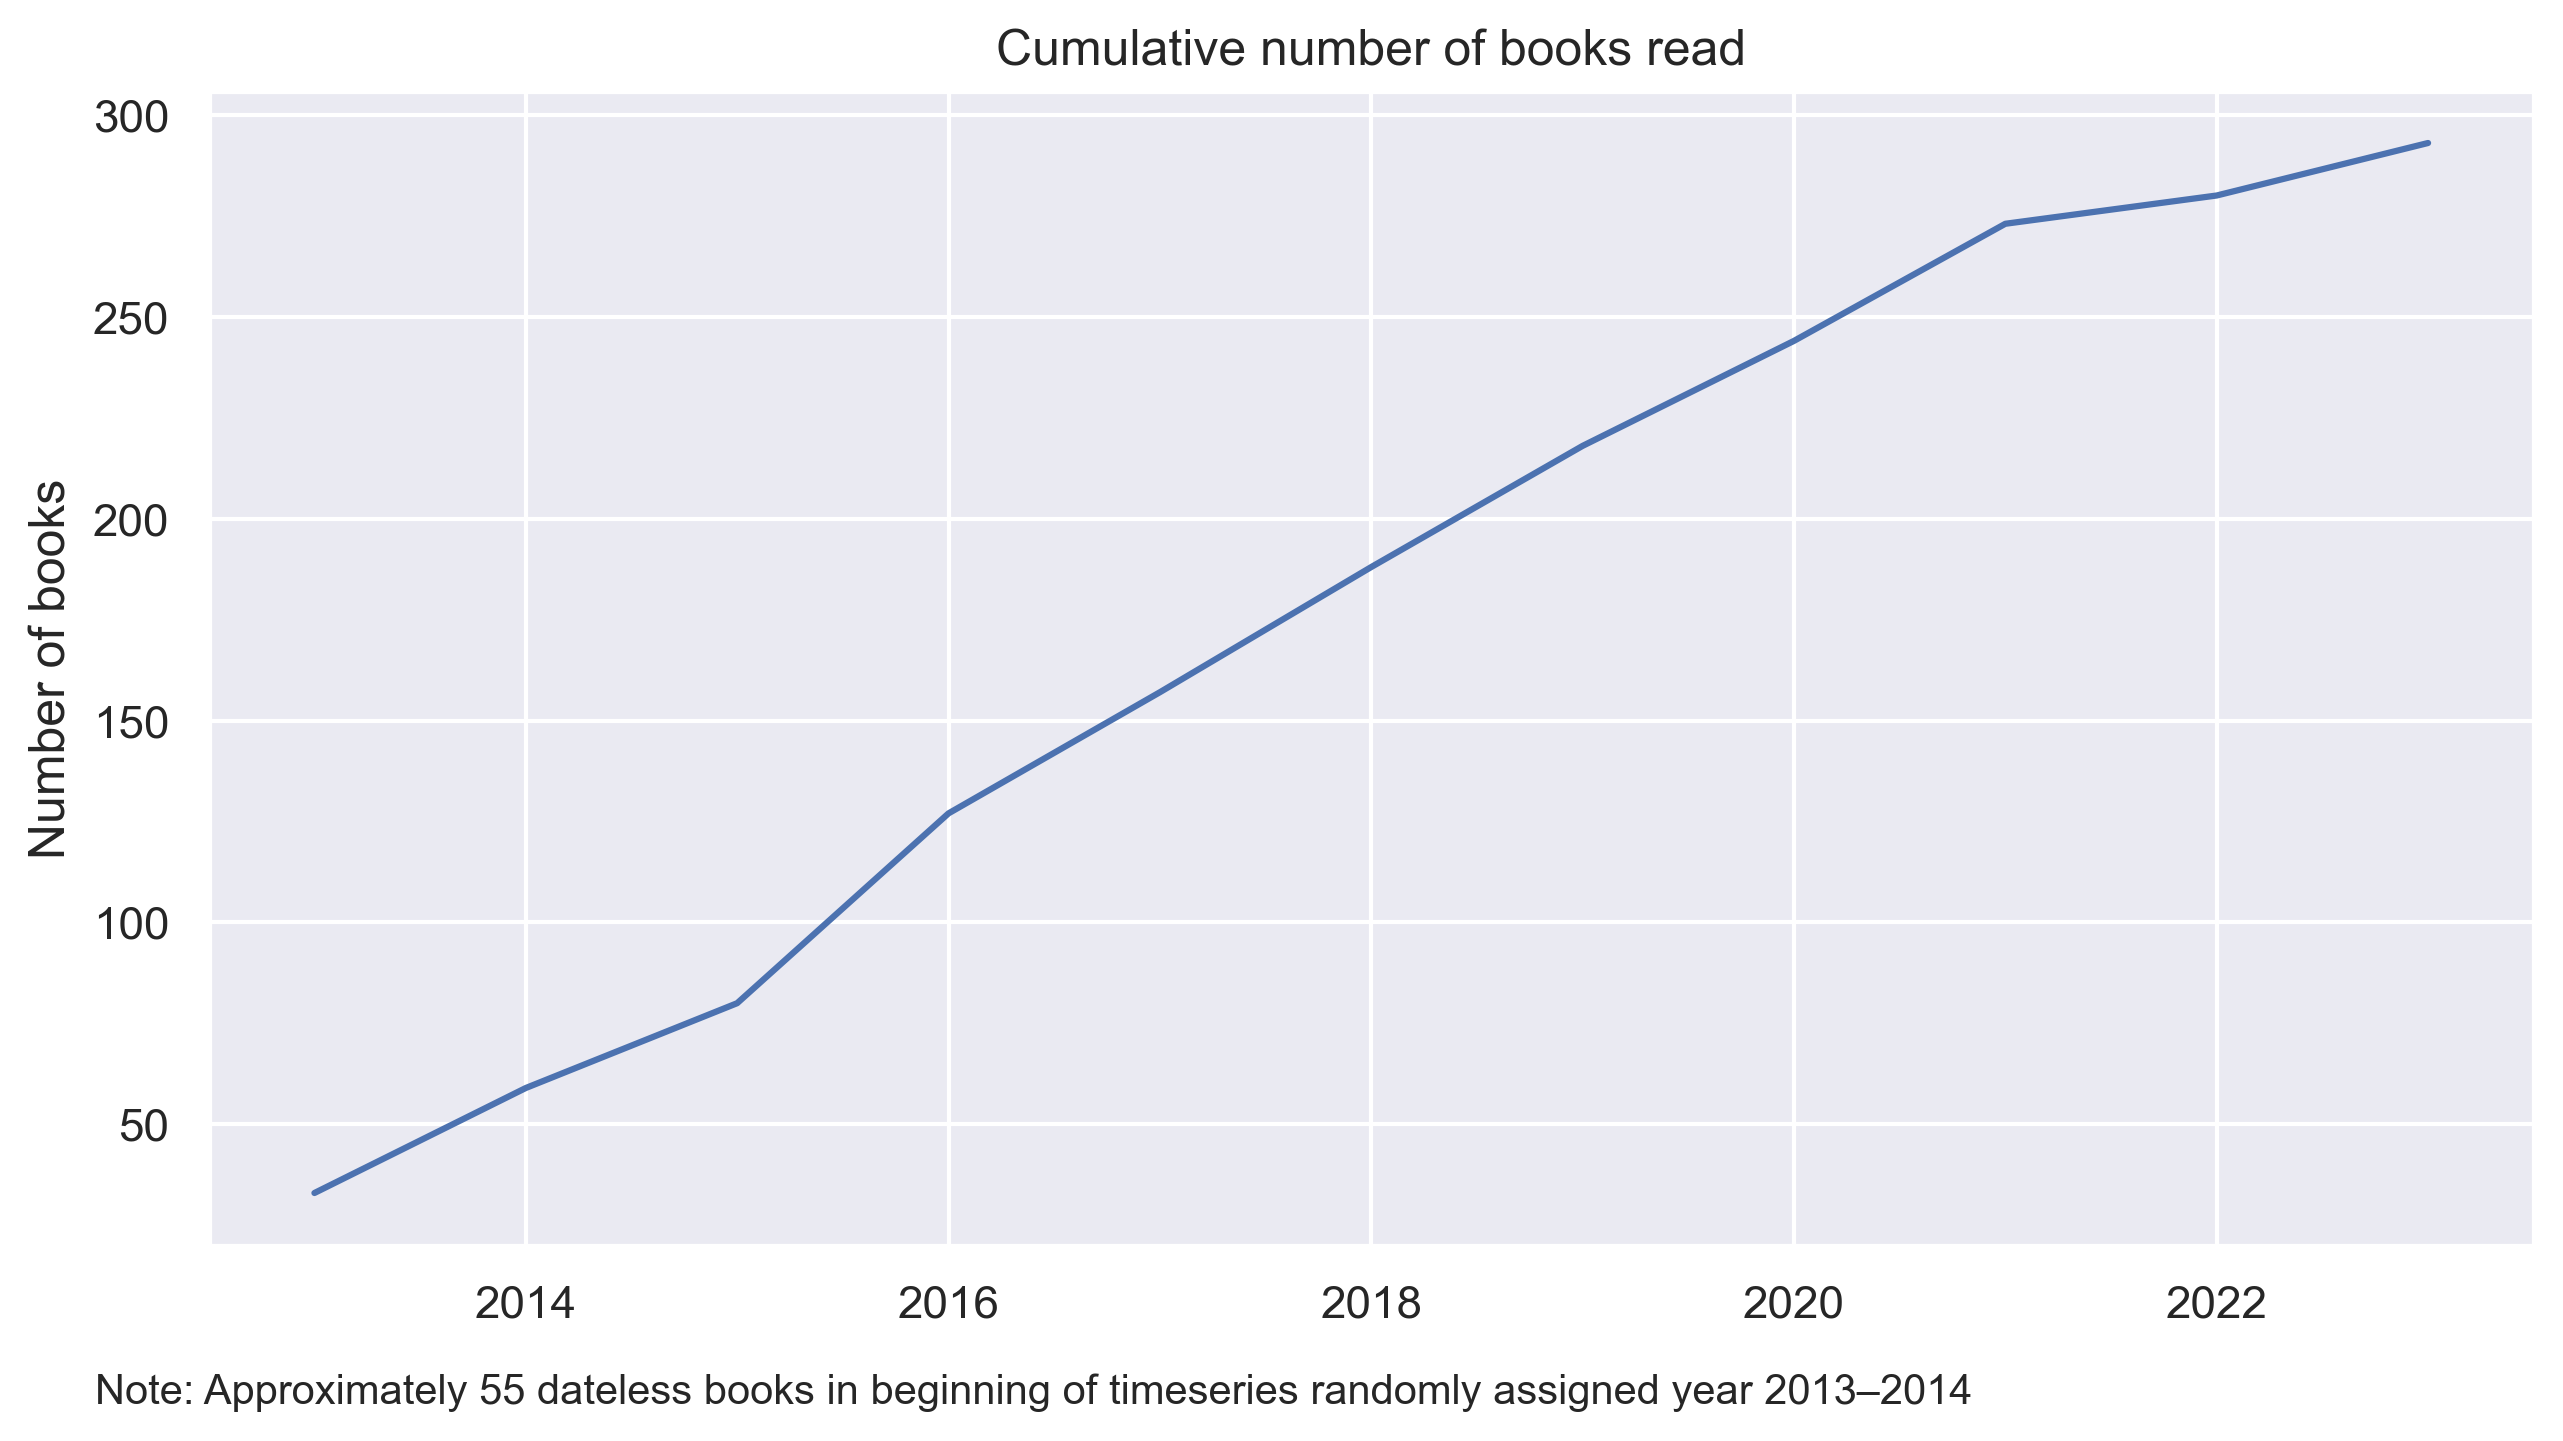
It’s no secret that I love my personal library. And it keeps expanding much faster than I can keep up (or, ehm, justify). As of 2023–12–23, I have 493 books in my bookshelves at home that are also registered in my little database. There are at least 50 or so books that I still need to register. Of the registered books, I’ve read 297 (or approximately 60%).

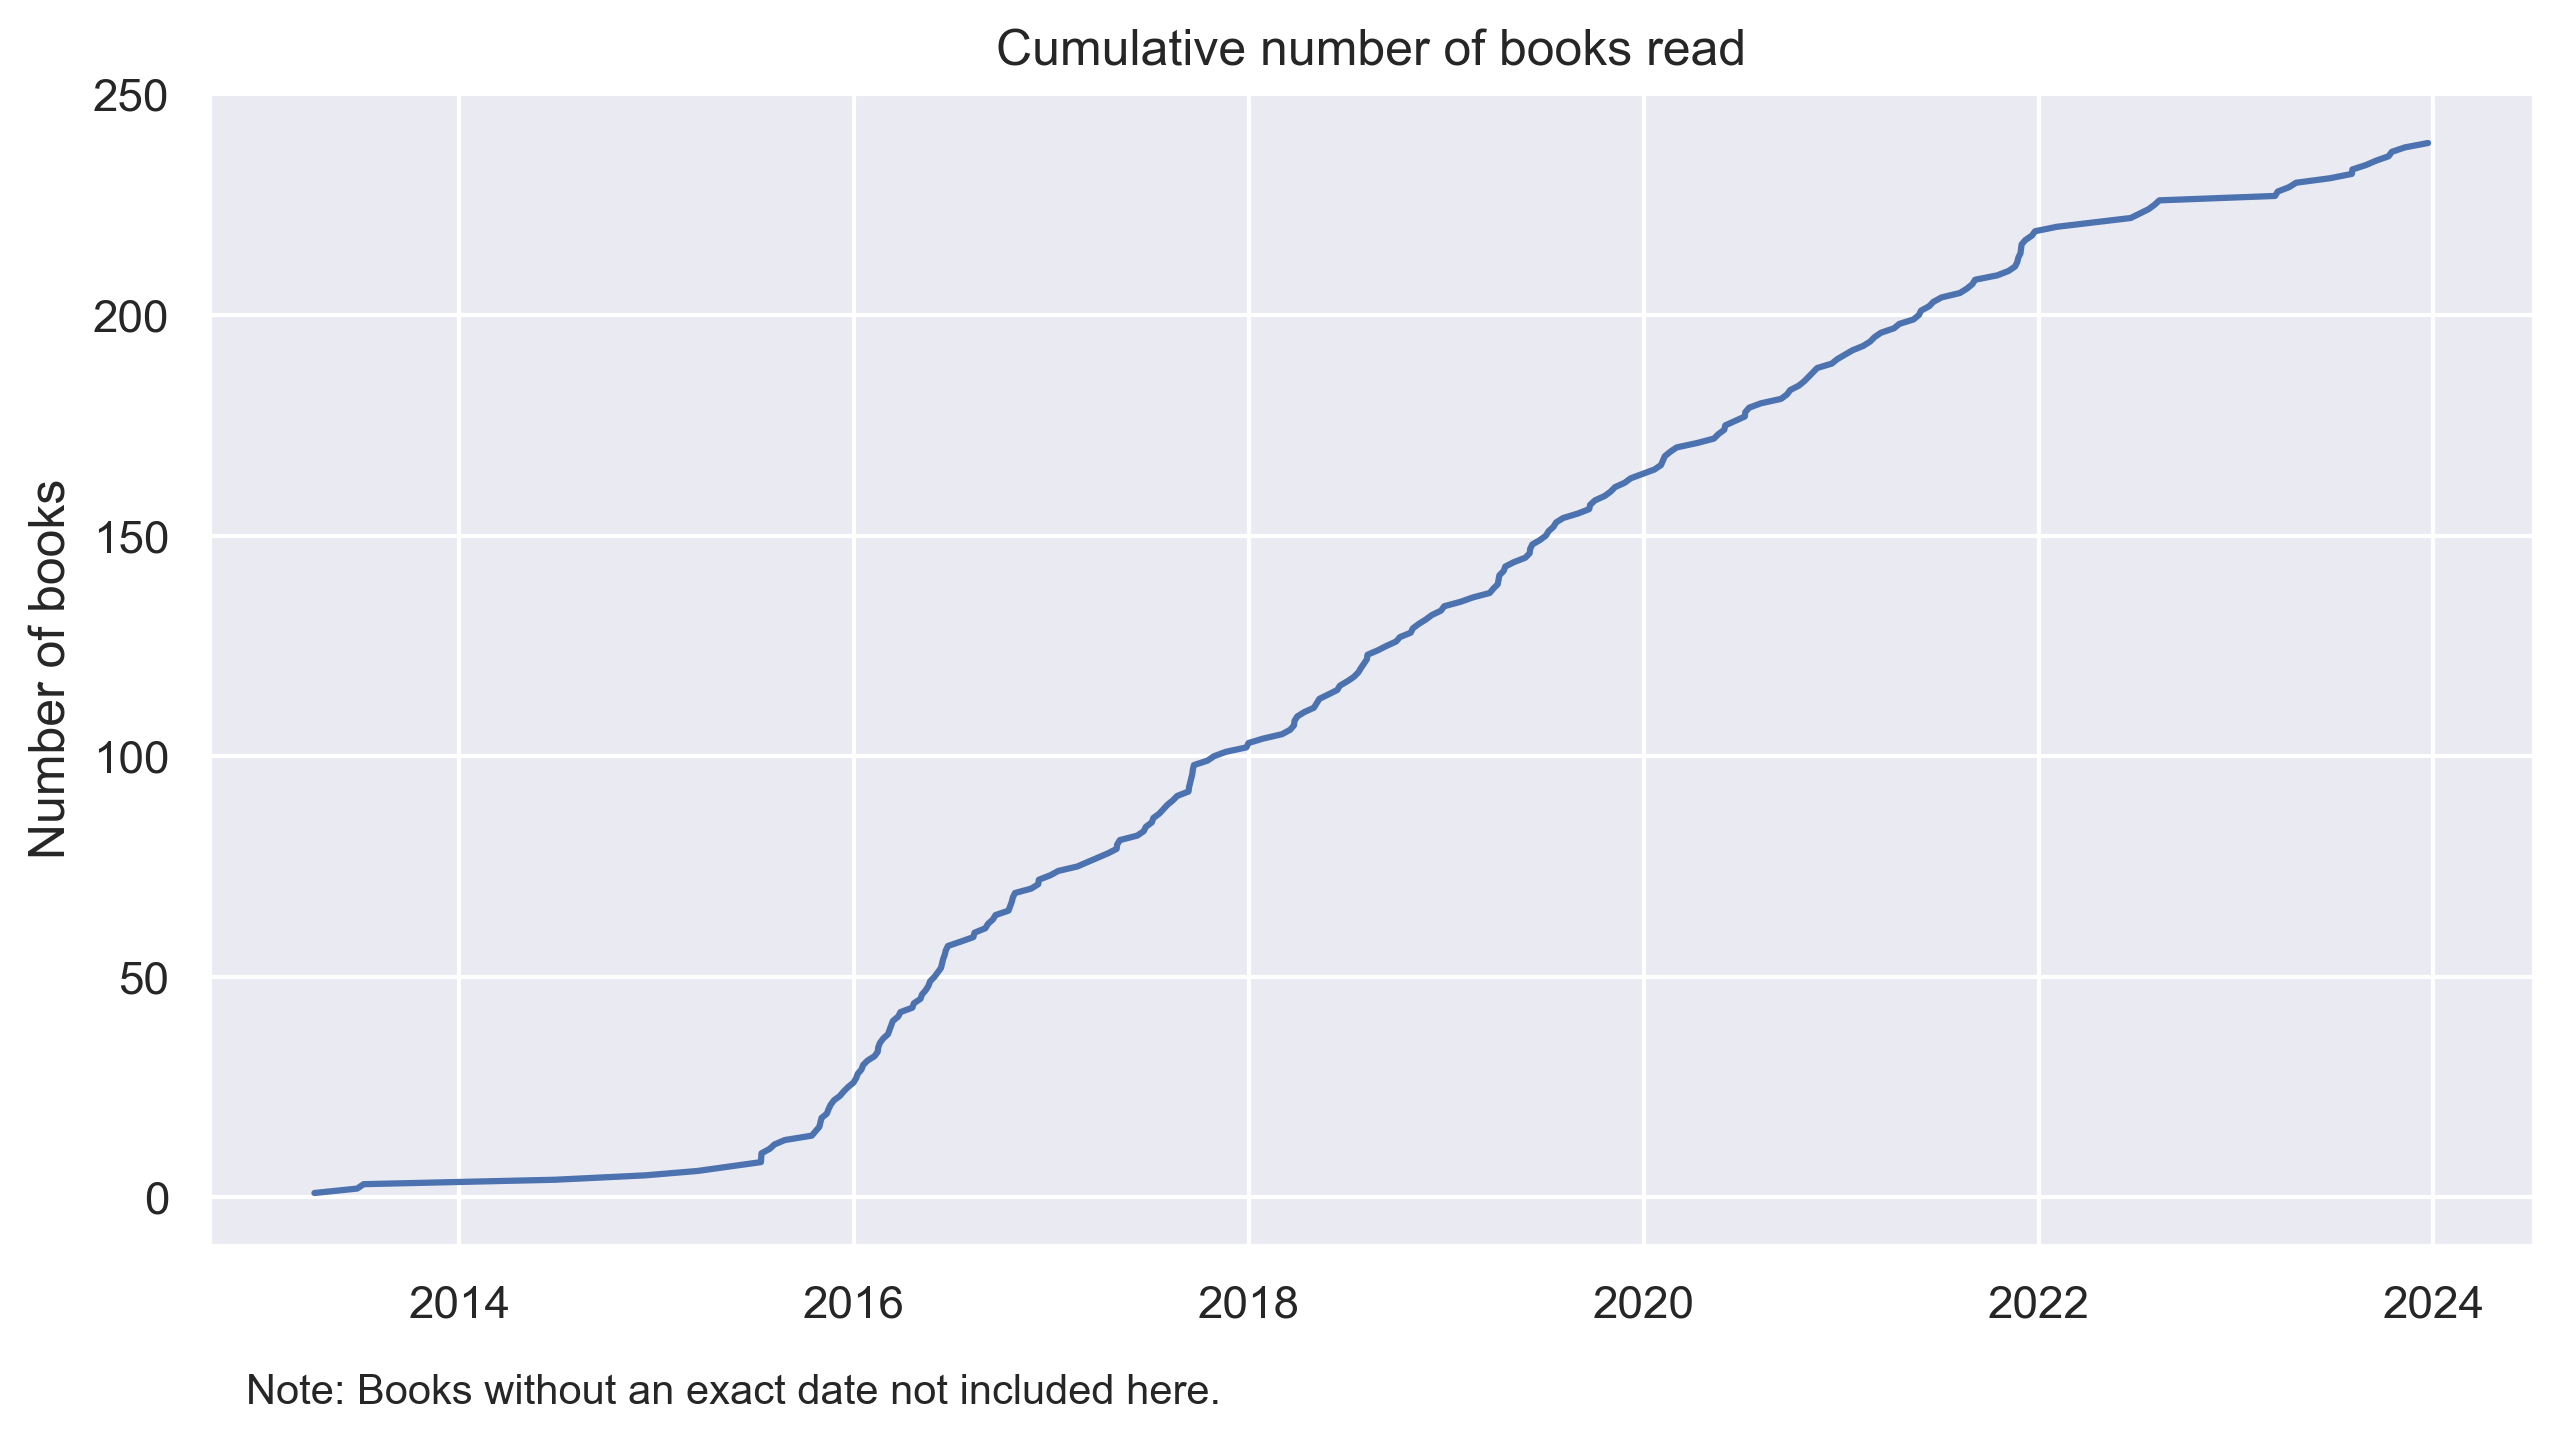
For most books, and especially after 2014, I also have an exact date read, and we could get this more granular plot.
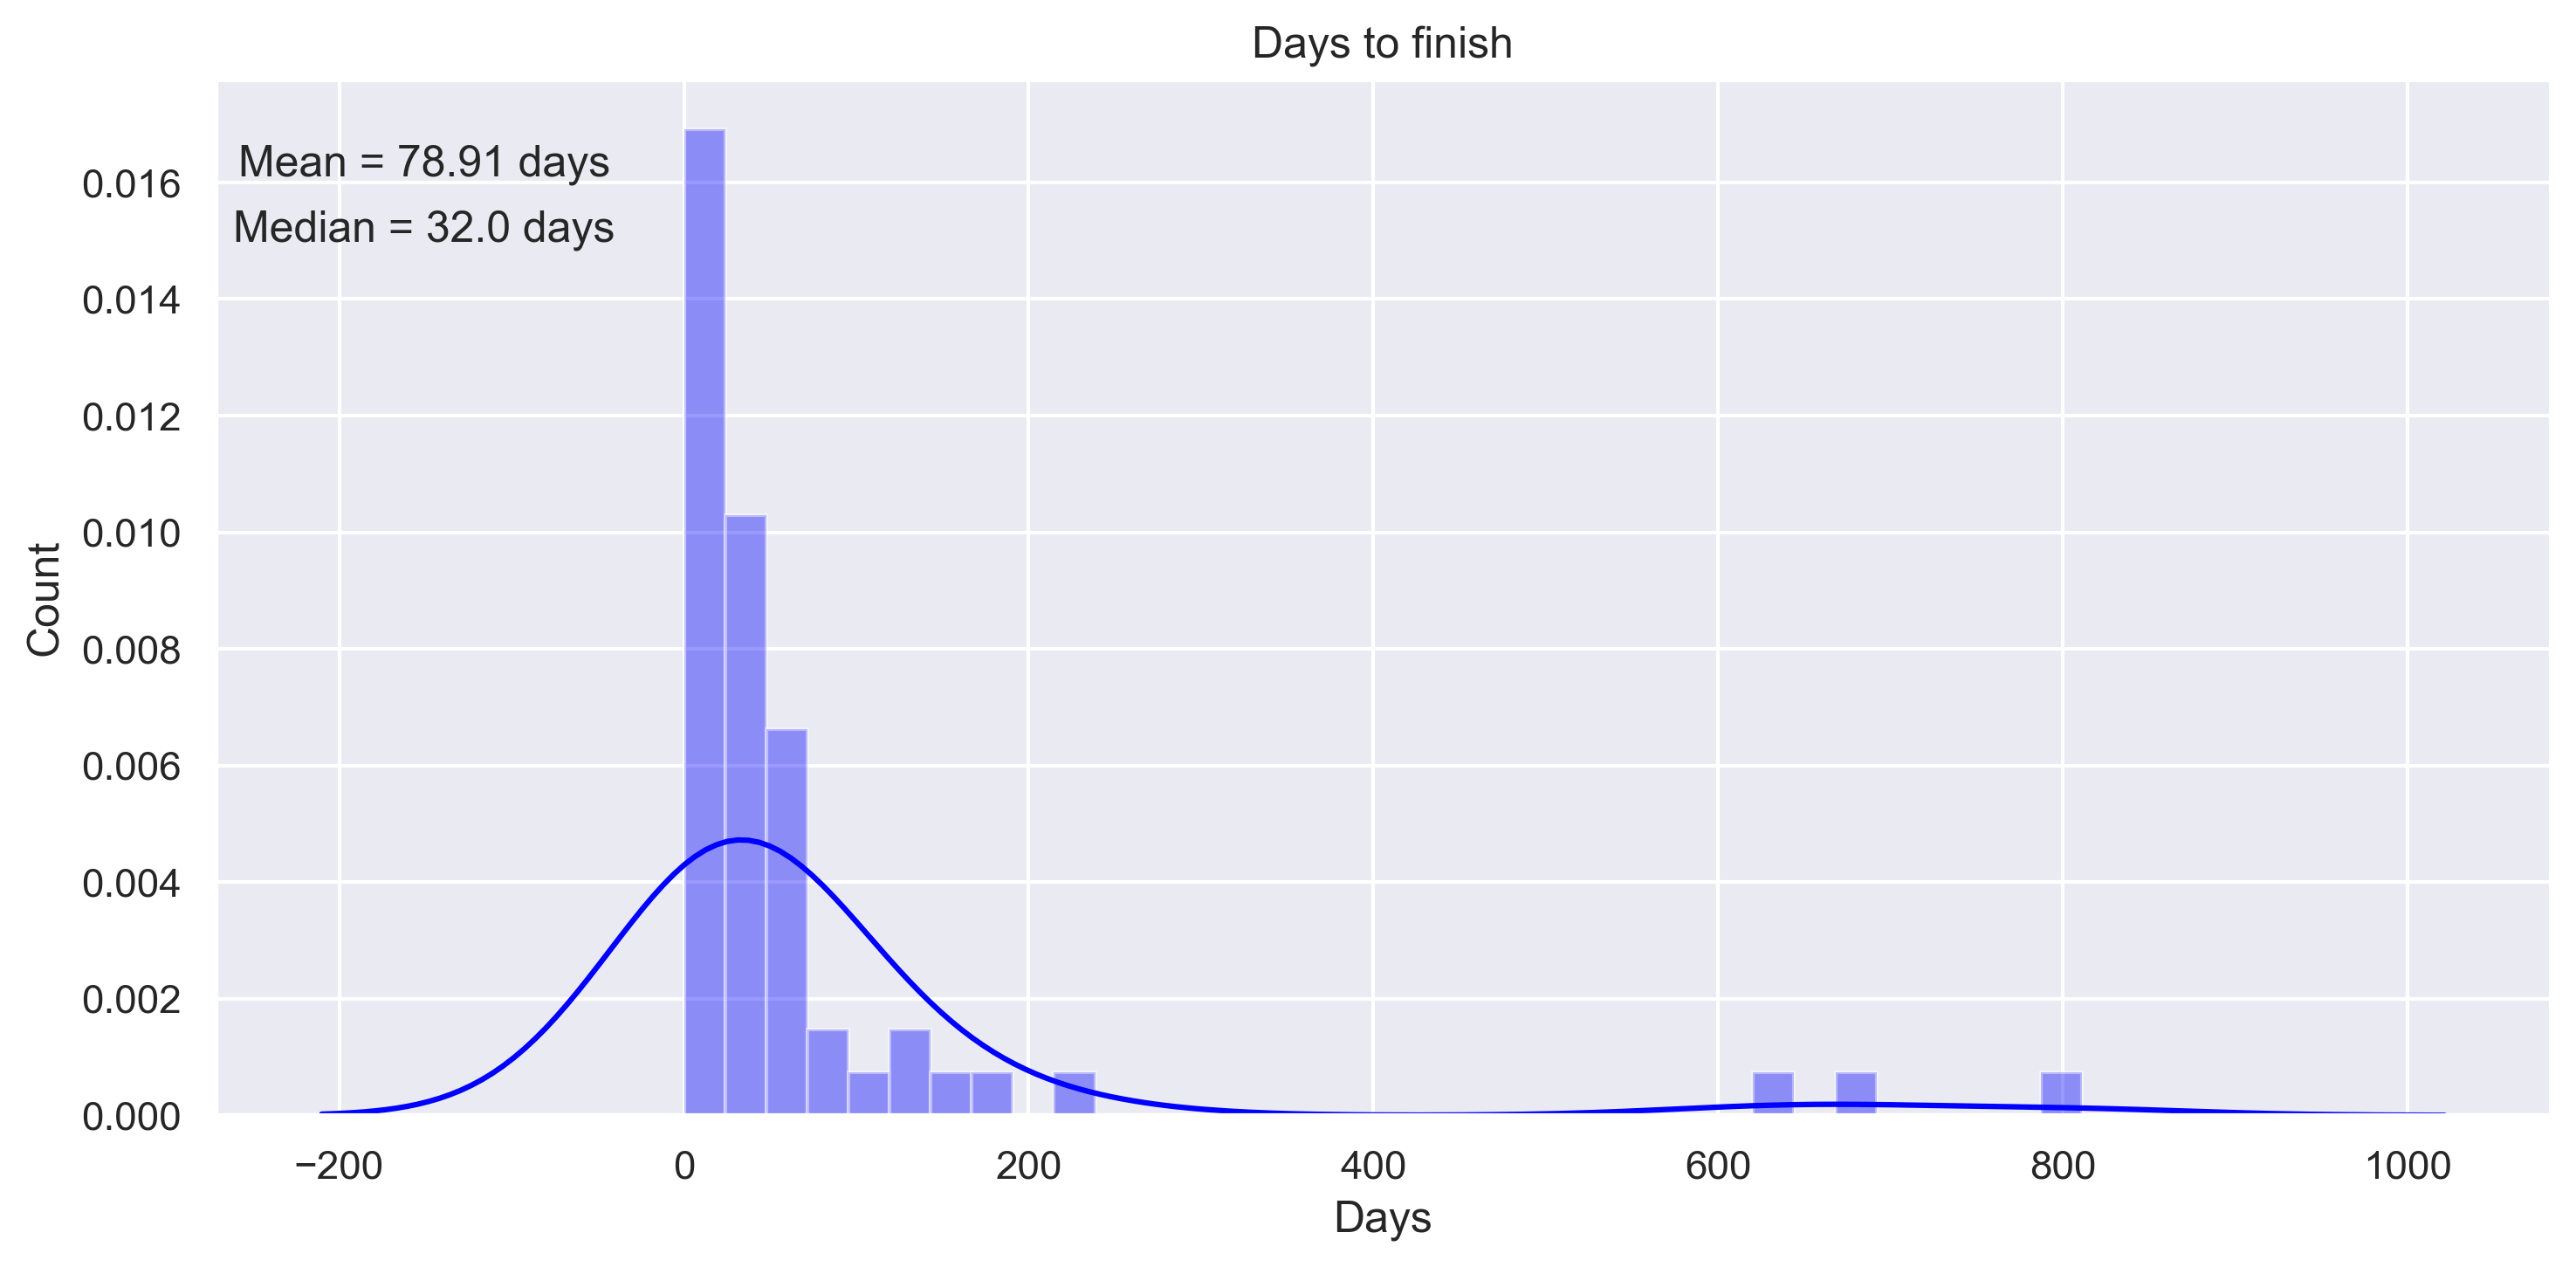
A lot of books are read within a month. Some books take years. Of course, what this means is that I’ve started reading a book and put it a way for many months, then picked it up again.
But this statistic is already very skewed, because I was a much more avid reader between 2014–2018, and would finish a book per 1.5 weeks on average. This is not super impressive compared to real avid readers, but life is not a competition. (At least I’m trying to convince myself of that)
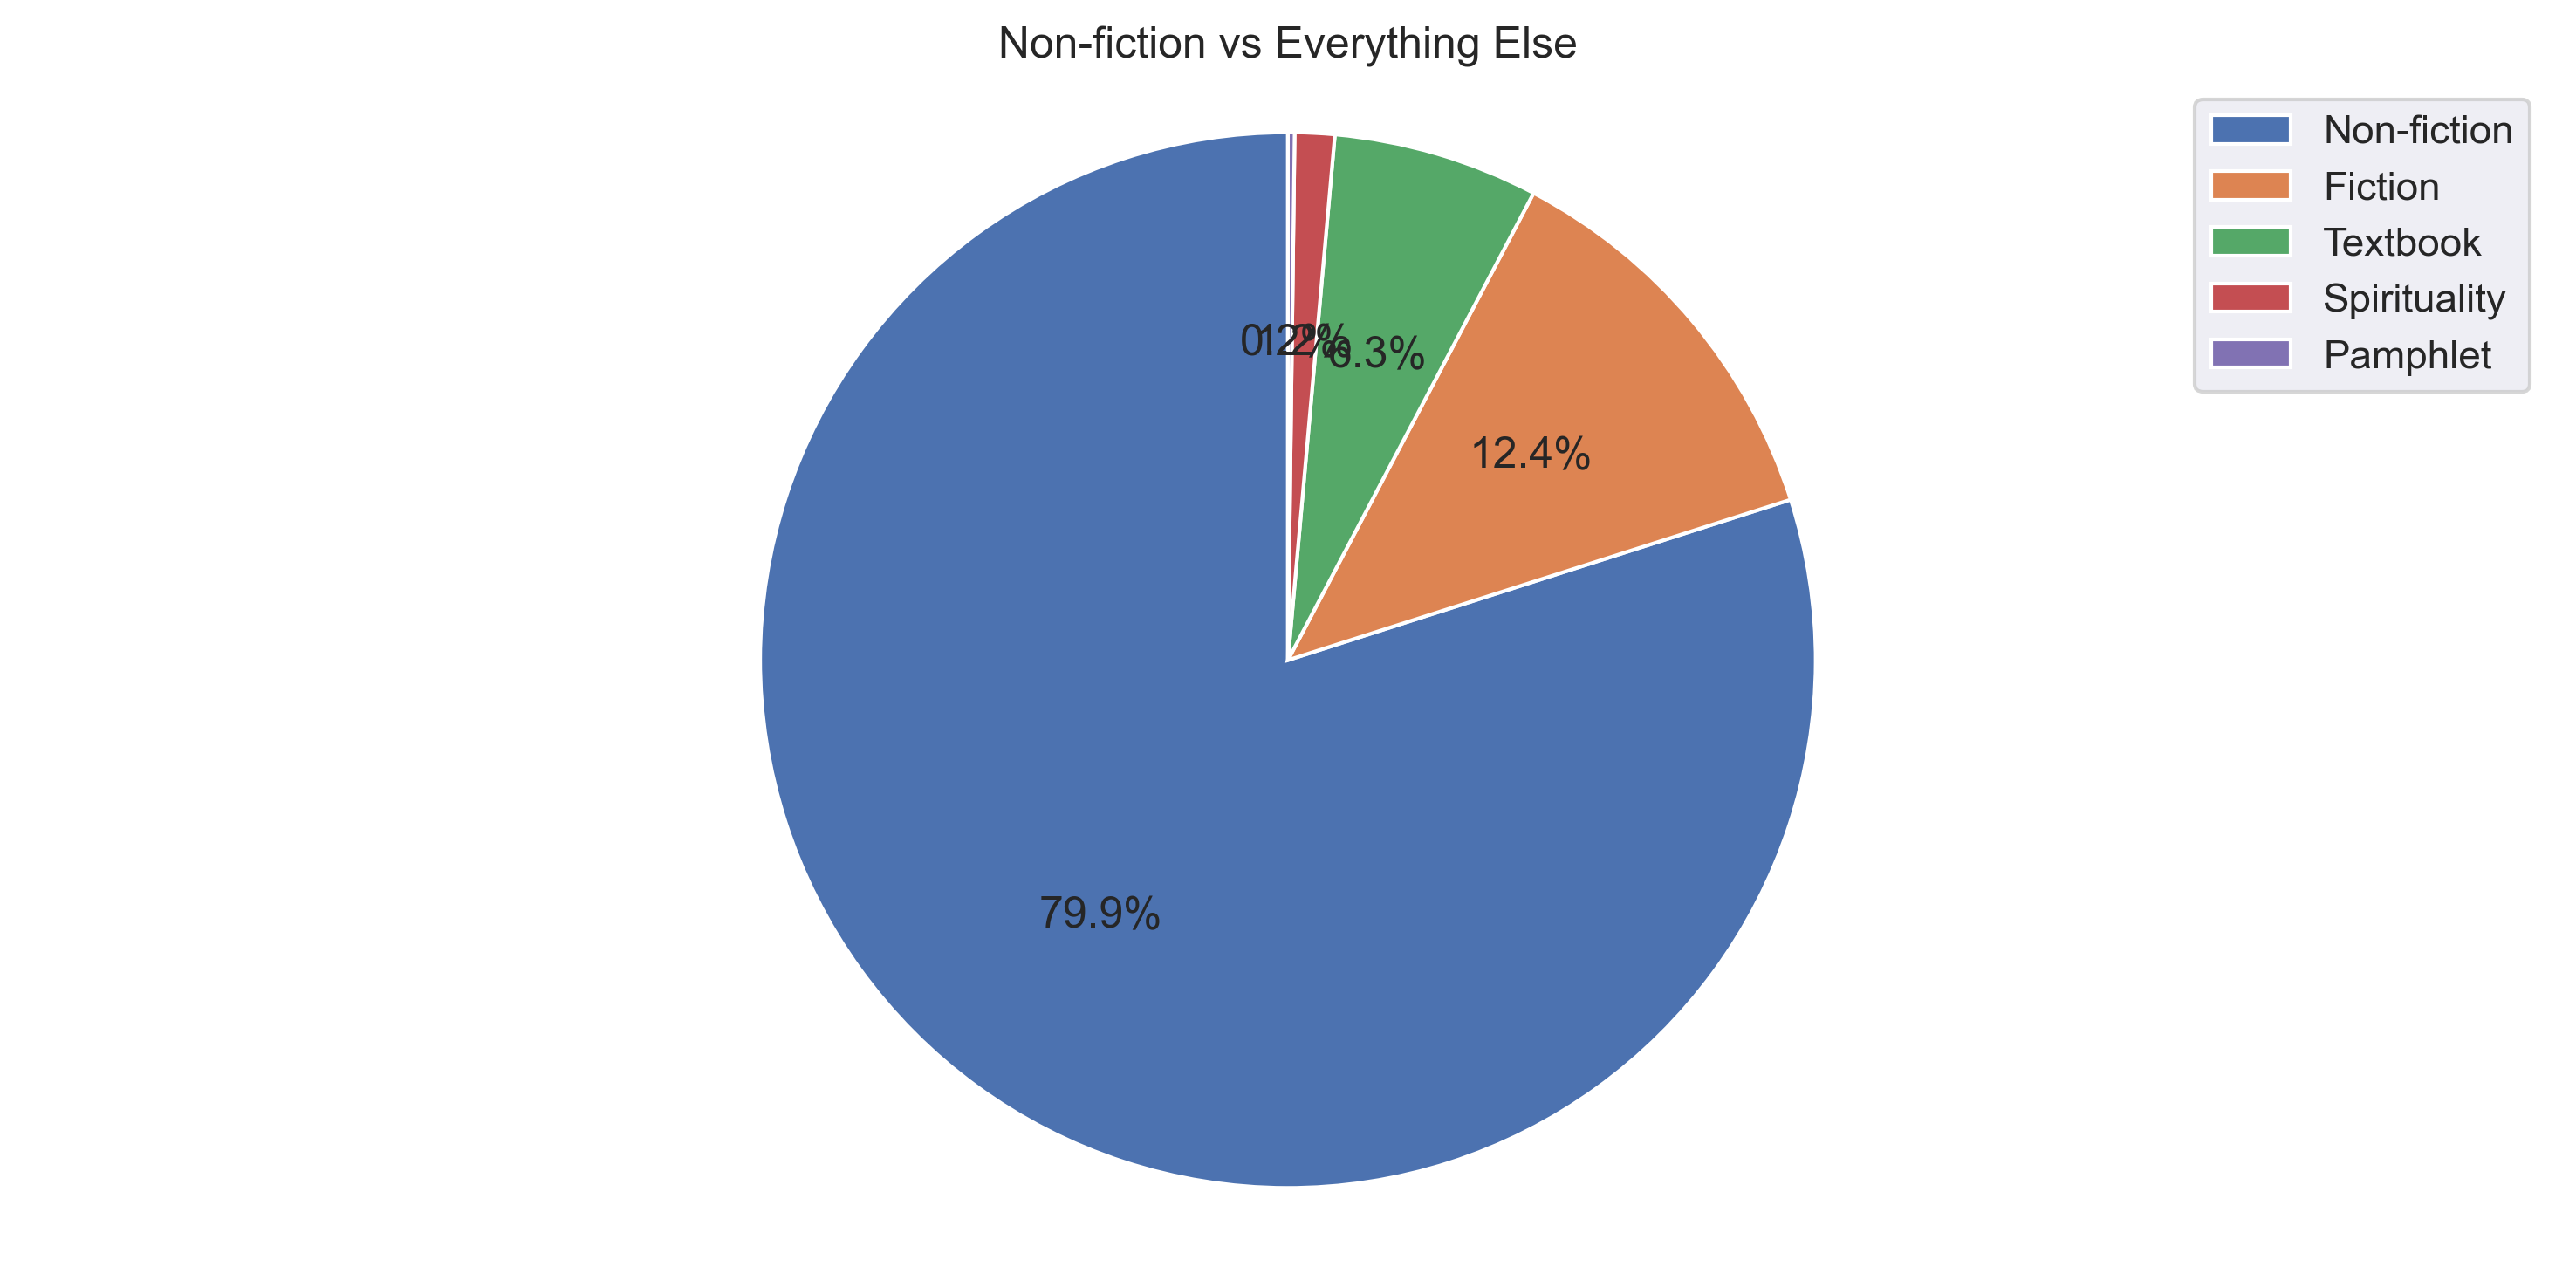
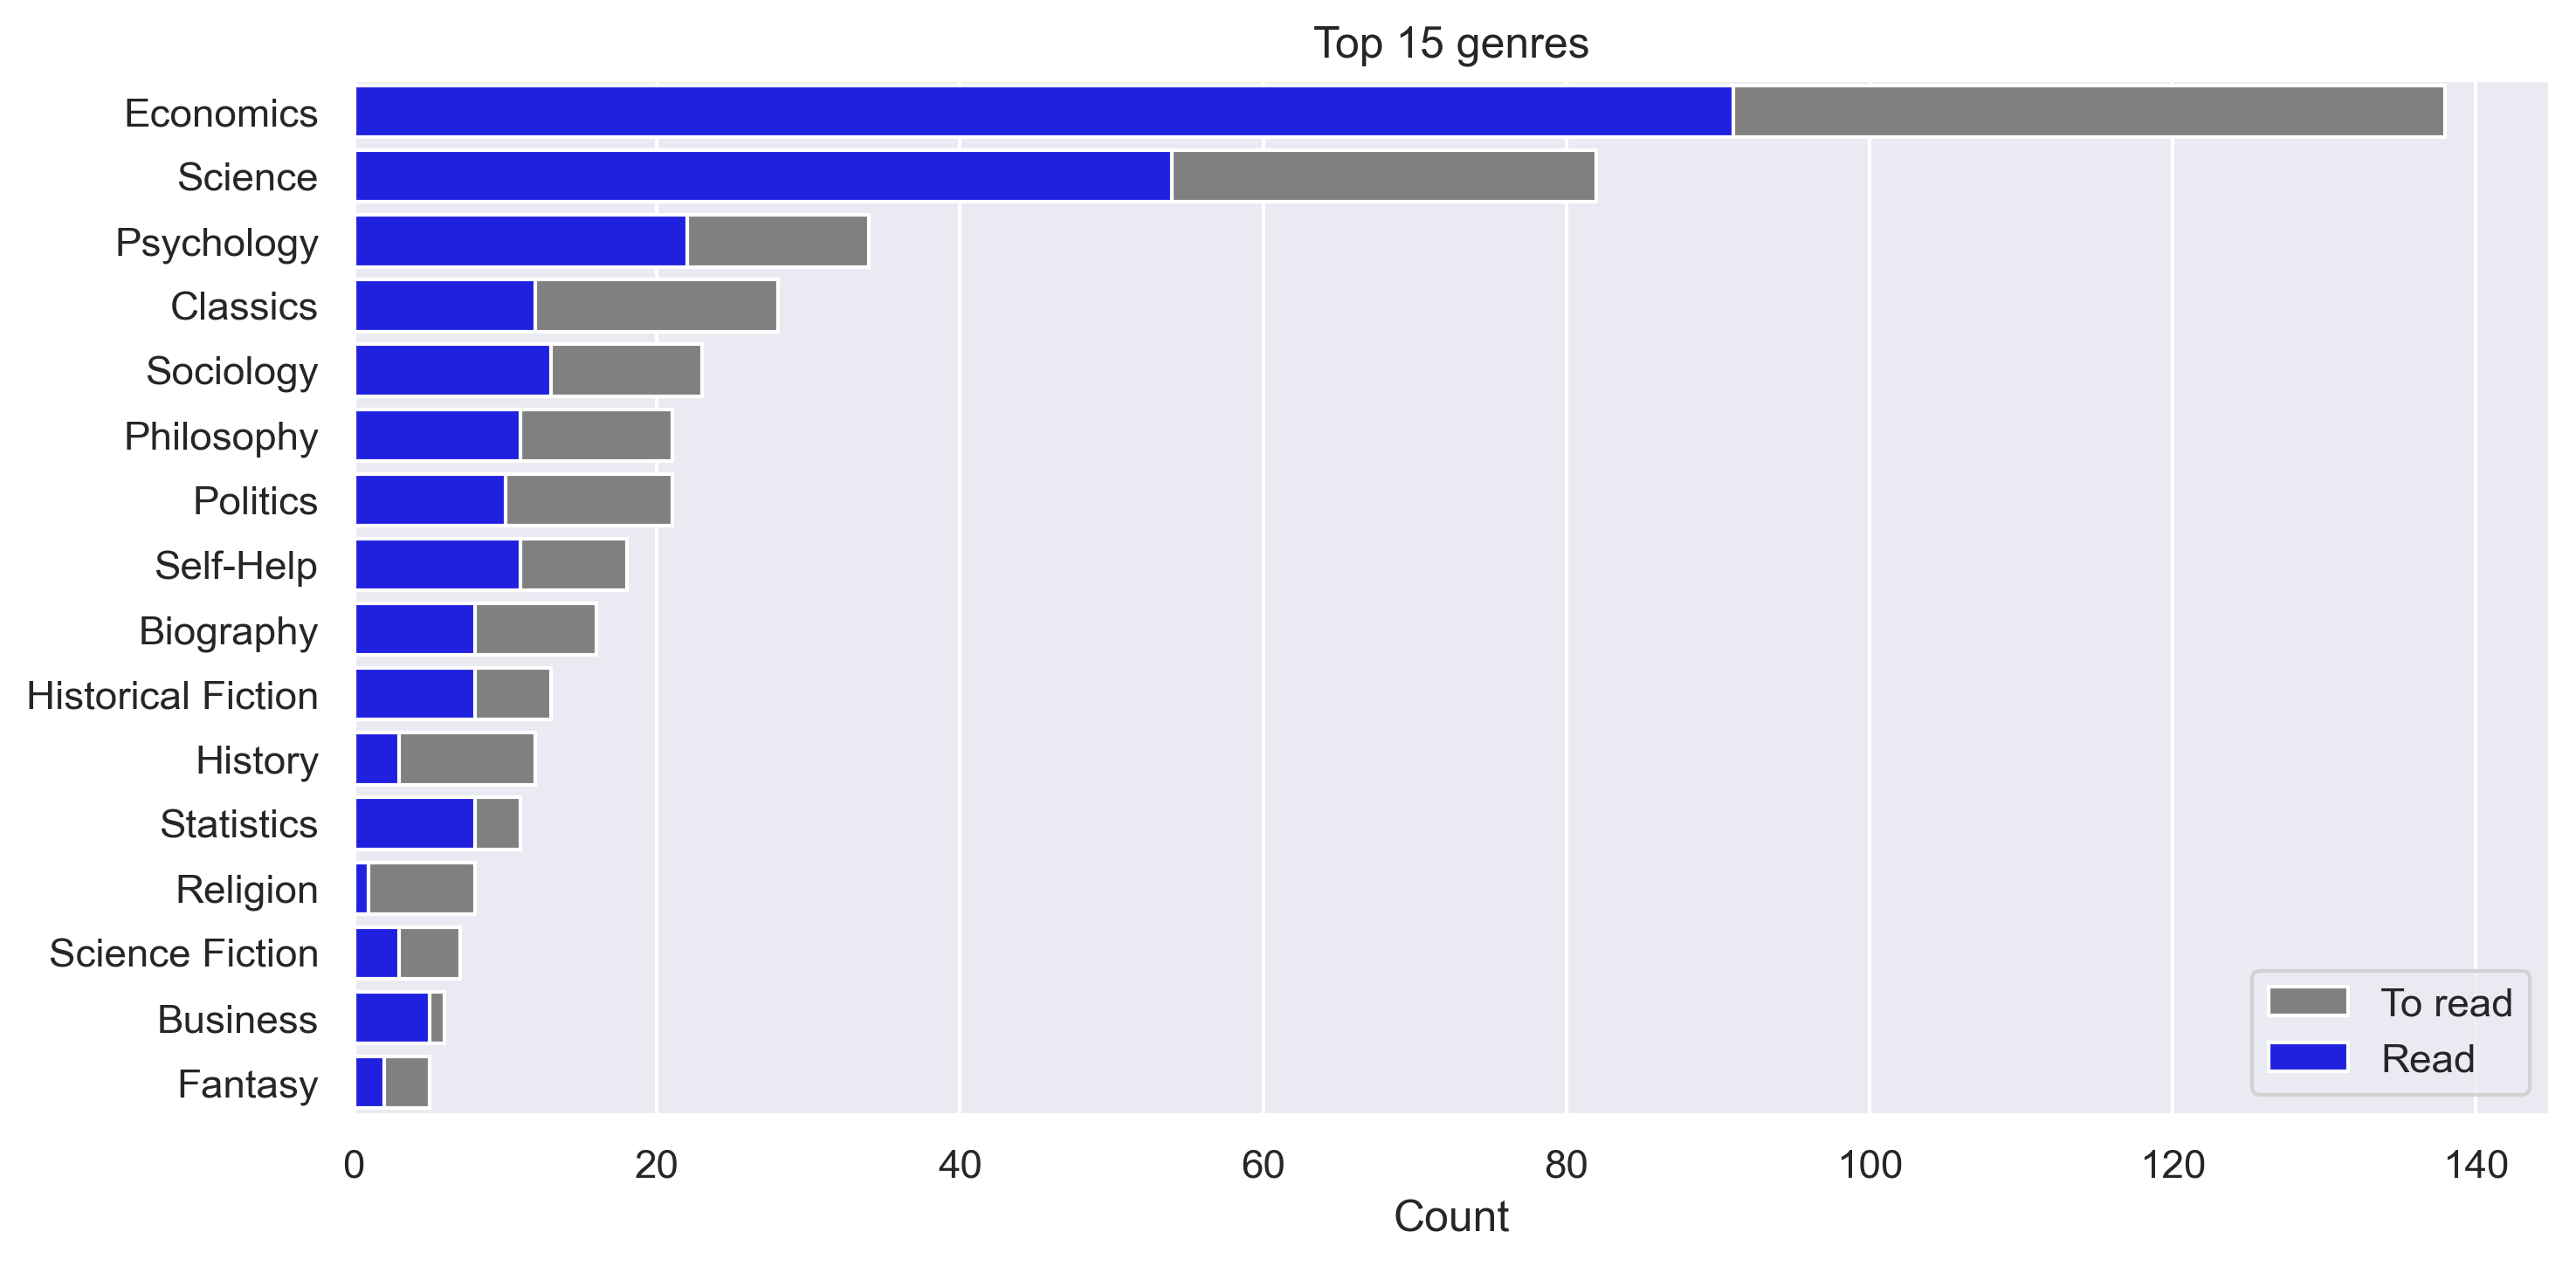
Most of what I own (and read) is non-fiction. I didn’t have the guts to classify the bible and psalm books as either fiction or non-fiction, so they got their own category spirituality.
My most owned (and read) 15 genres are, to no ones surprise, as follows:
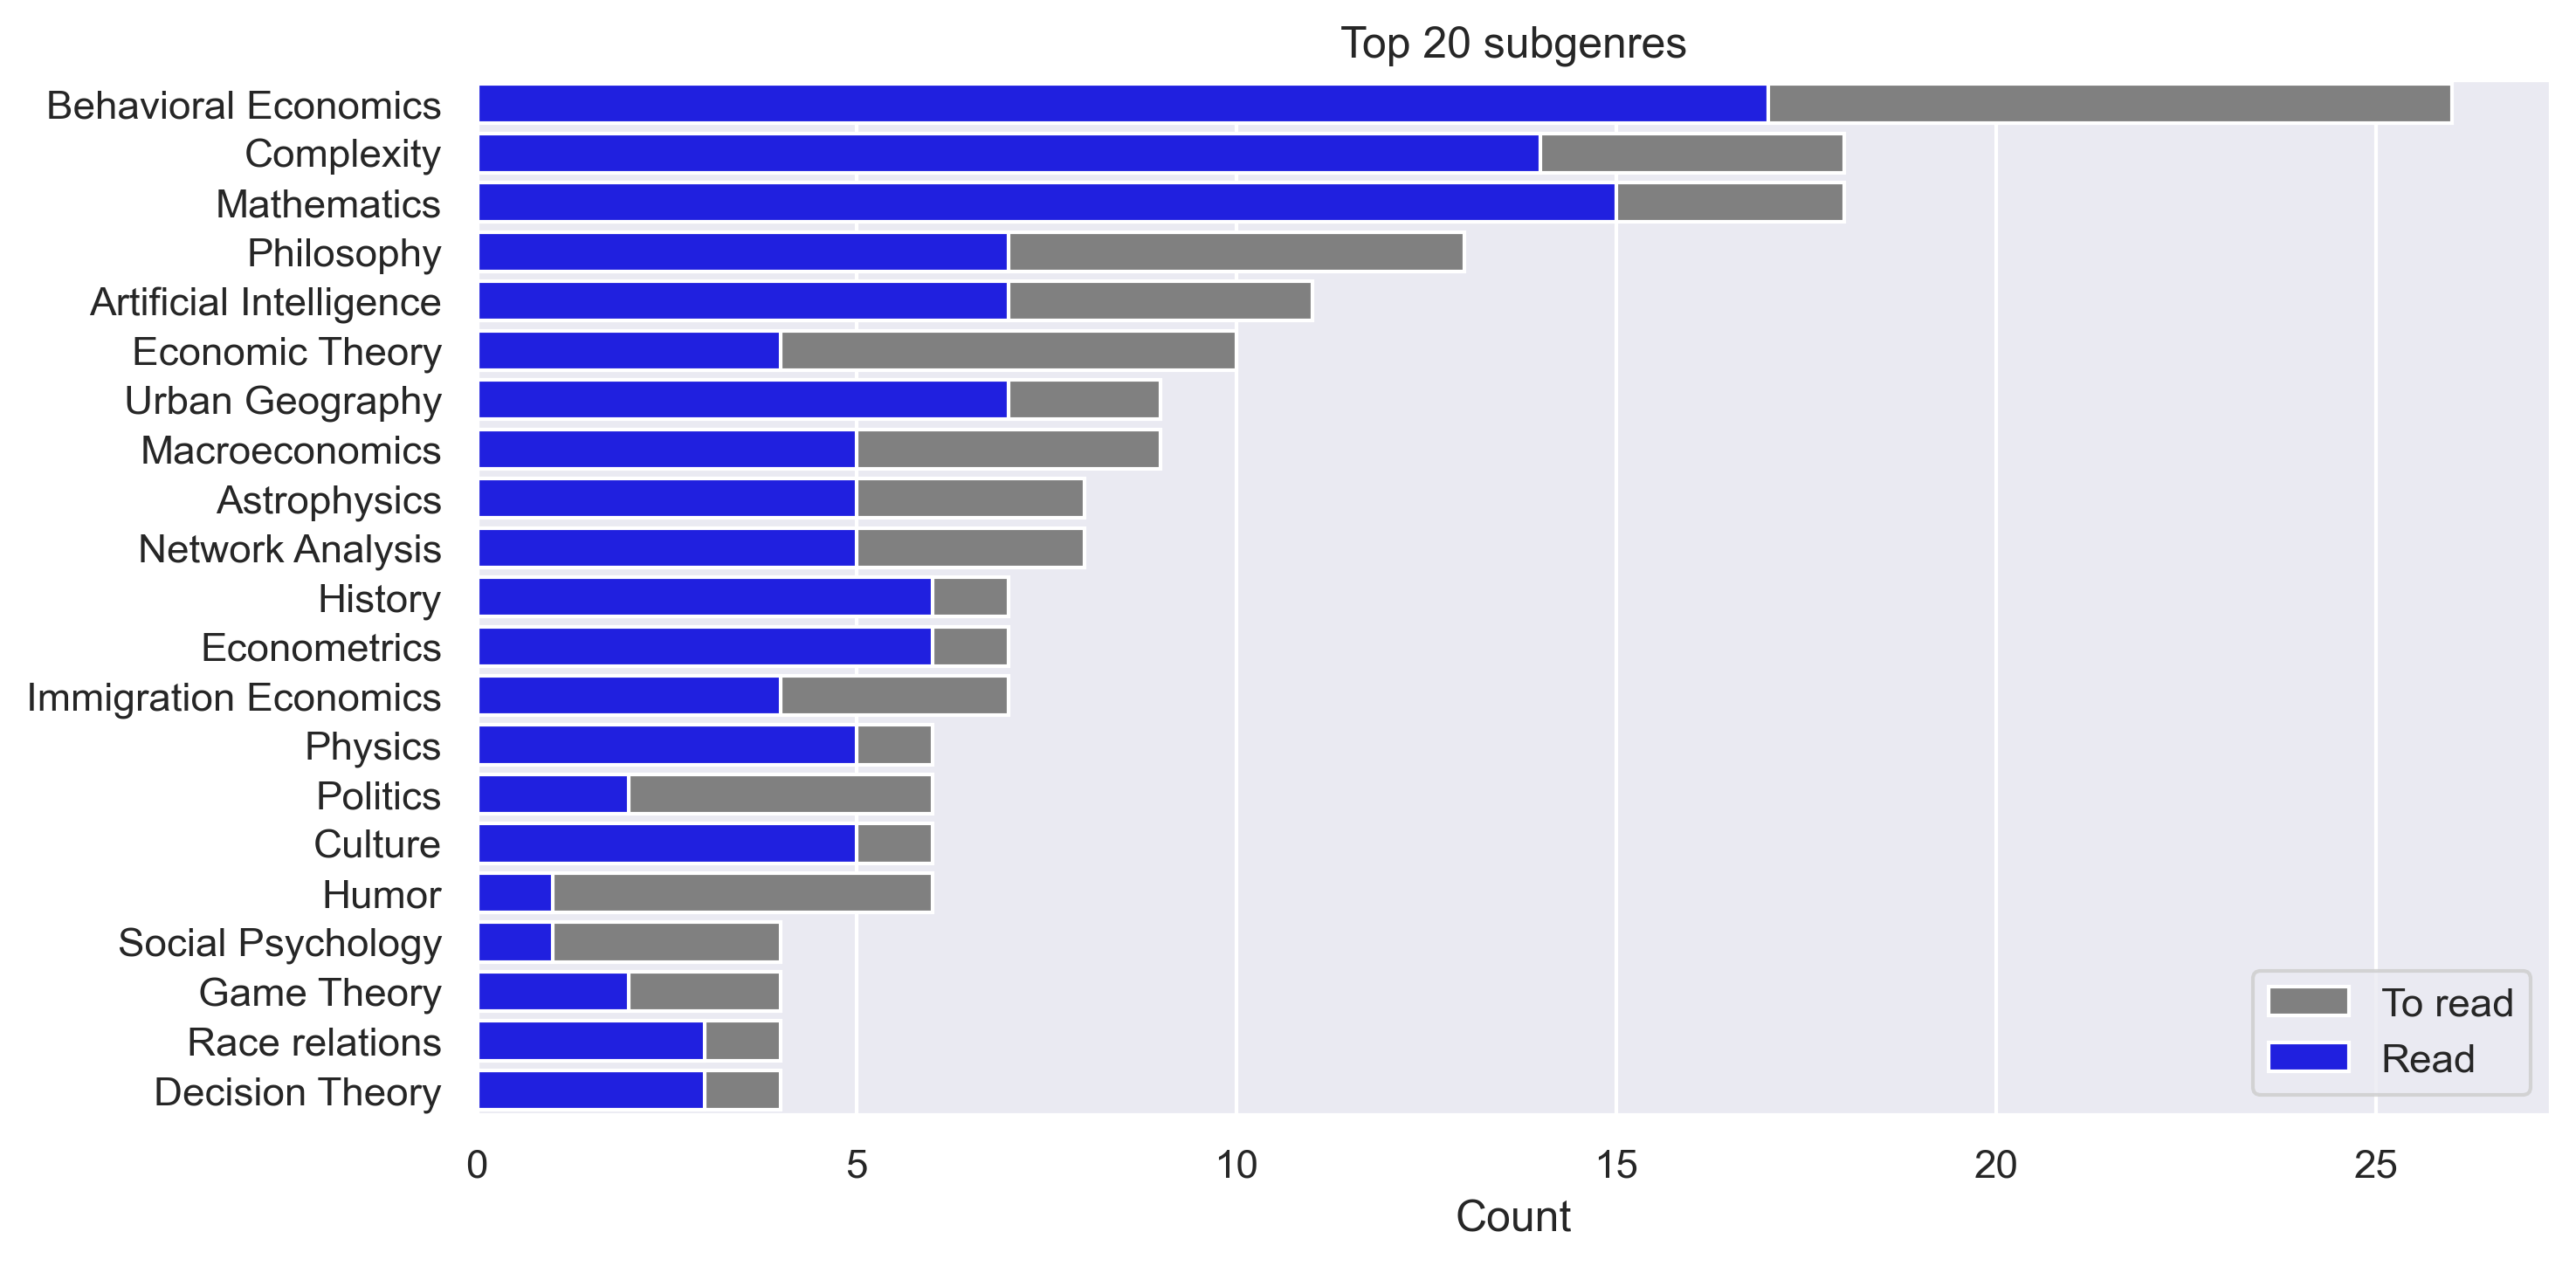
For some books, I have also classified subgenres.
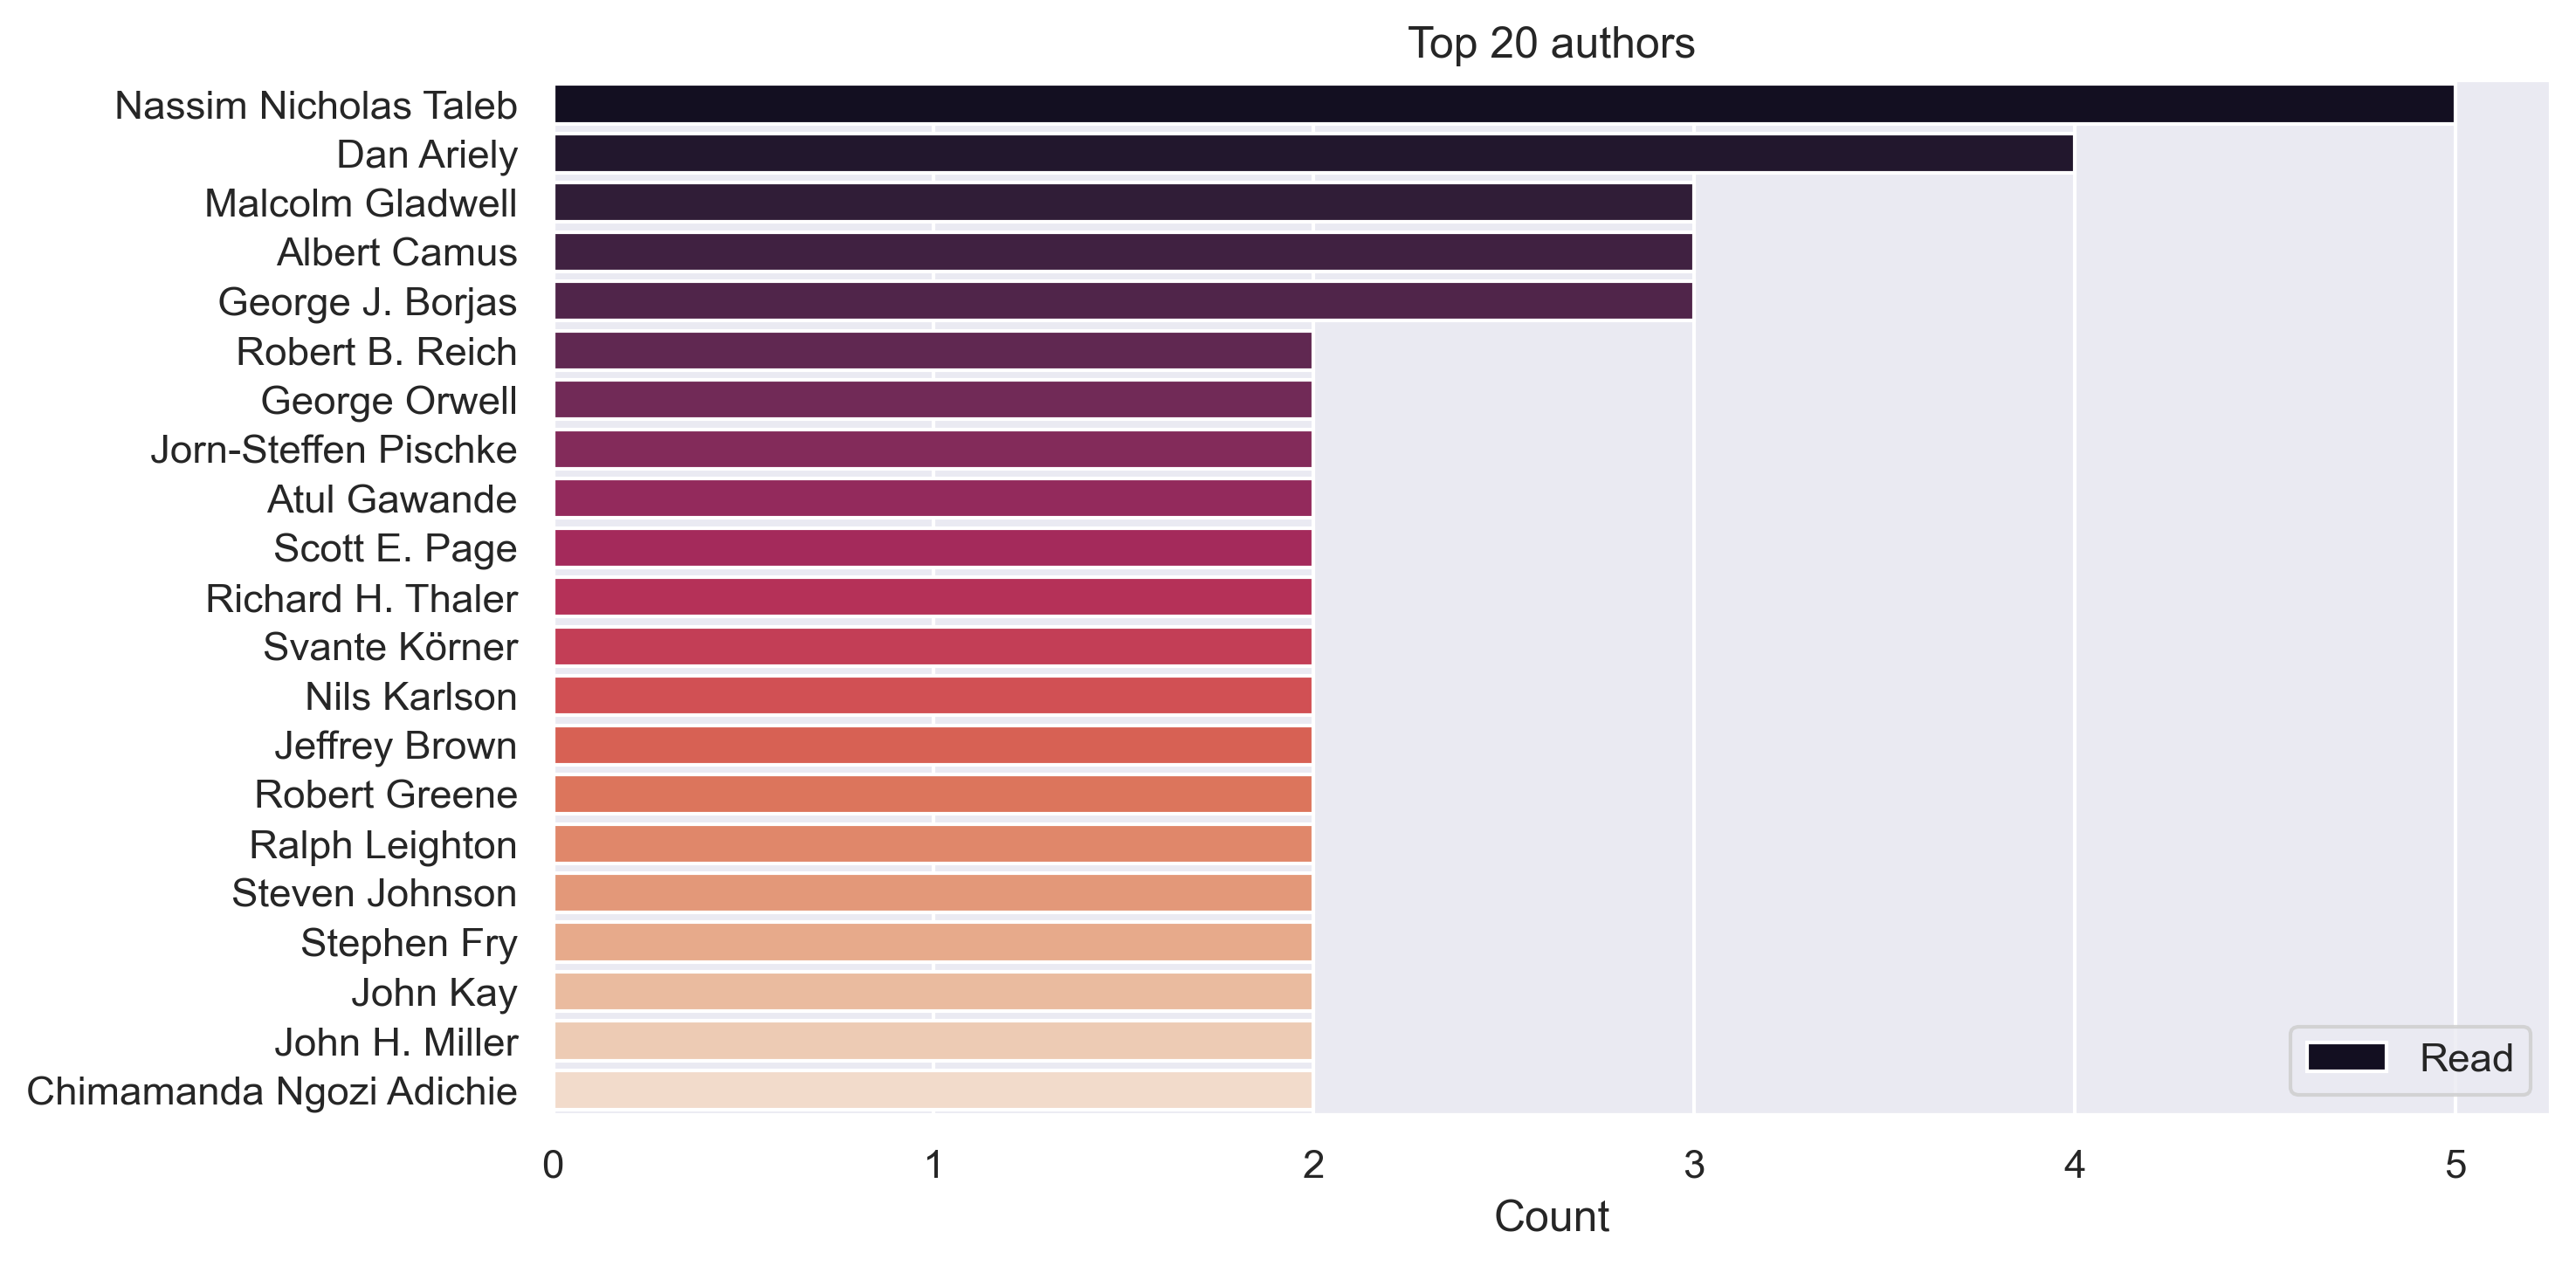
My most read author is the one and only N.N.T. Then there’s popular non-fiction writers Ariely and Gladwell. One or two textbook authors made their way in there as well.
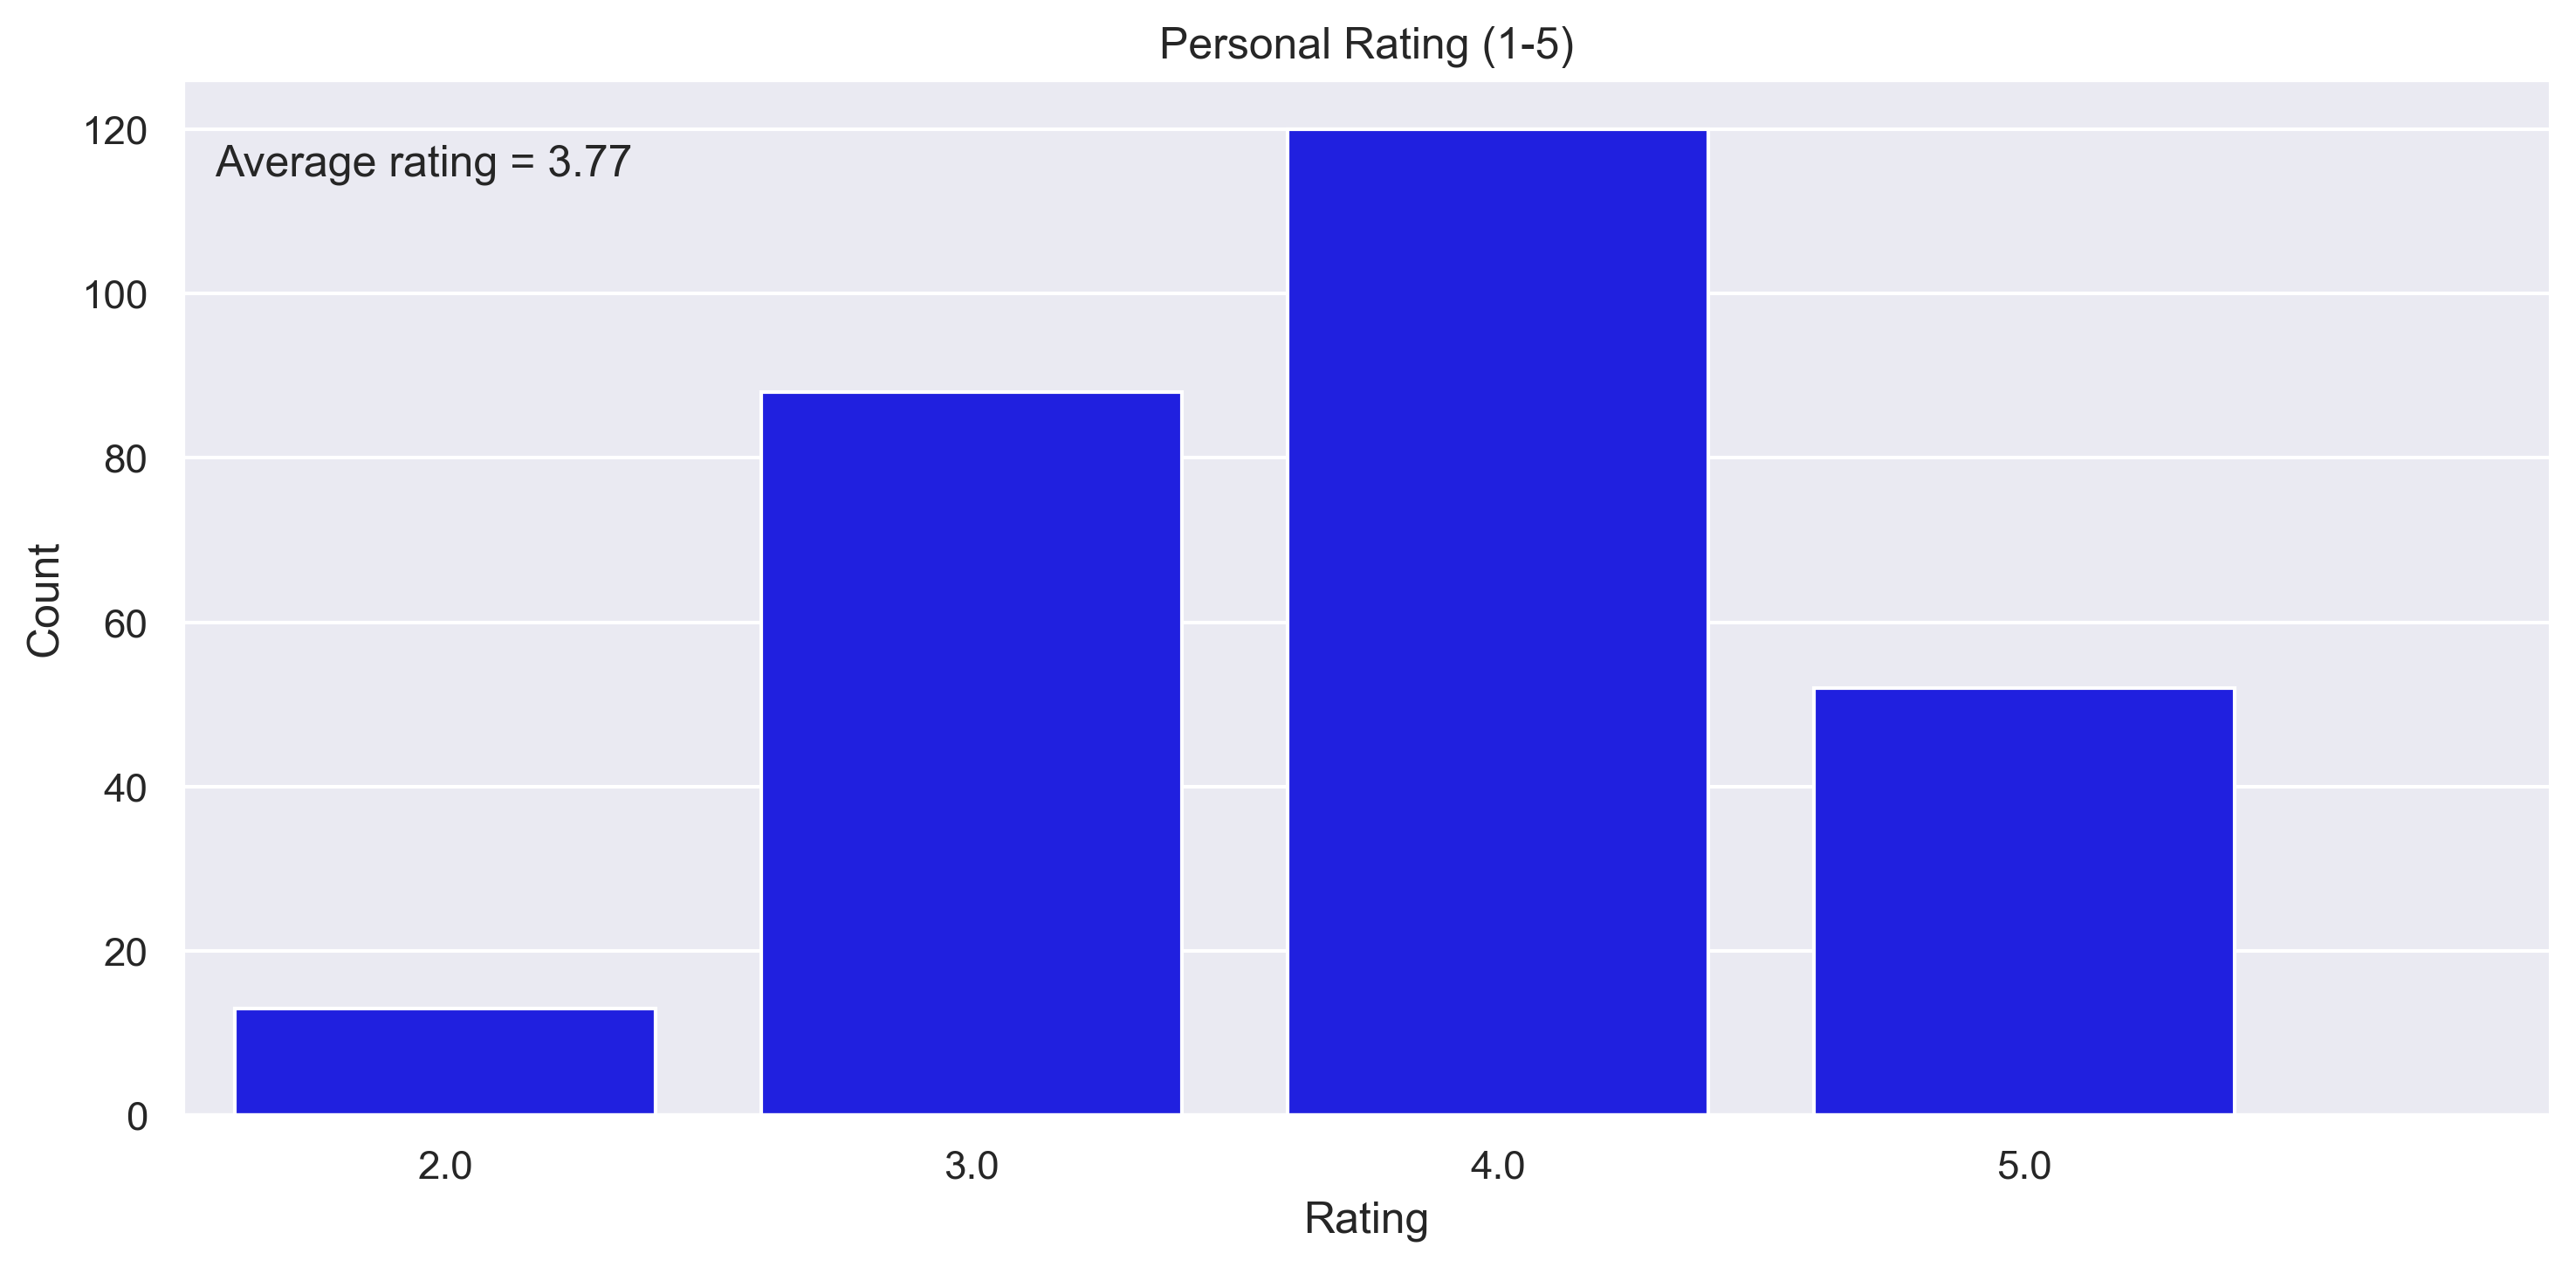
For most of the books that I’ve read, I added a rating from 1–5, with 5 being a gripping book
that I could not put away or that made me think differently about life, and the lower ratings are just awful books. Naturally, and thank God, I have no 1-star ratings (if it were that bad, I wouldn’t have bought the book in the first place)! The 2-stars are the fallen angels, I bought them with the hopes of them being 4s and 5s, but they quickly made their way to a solid 2. The 3 stars are in actuality 2s but I either really like the author or the topic (despite my disliking of many details). 4 stars are all round great books.
I’d recommend them to folks.
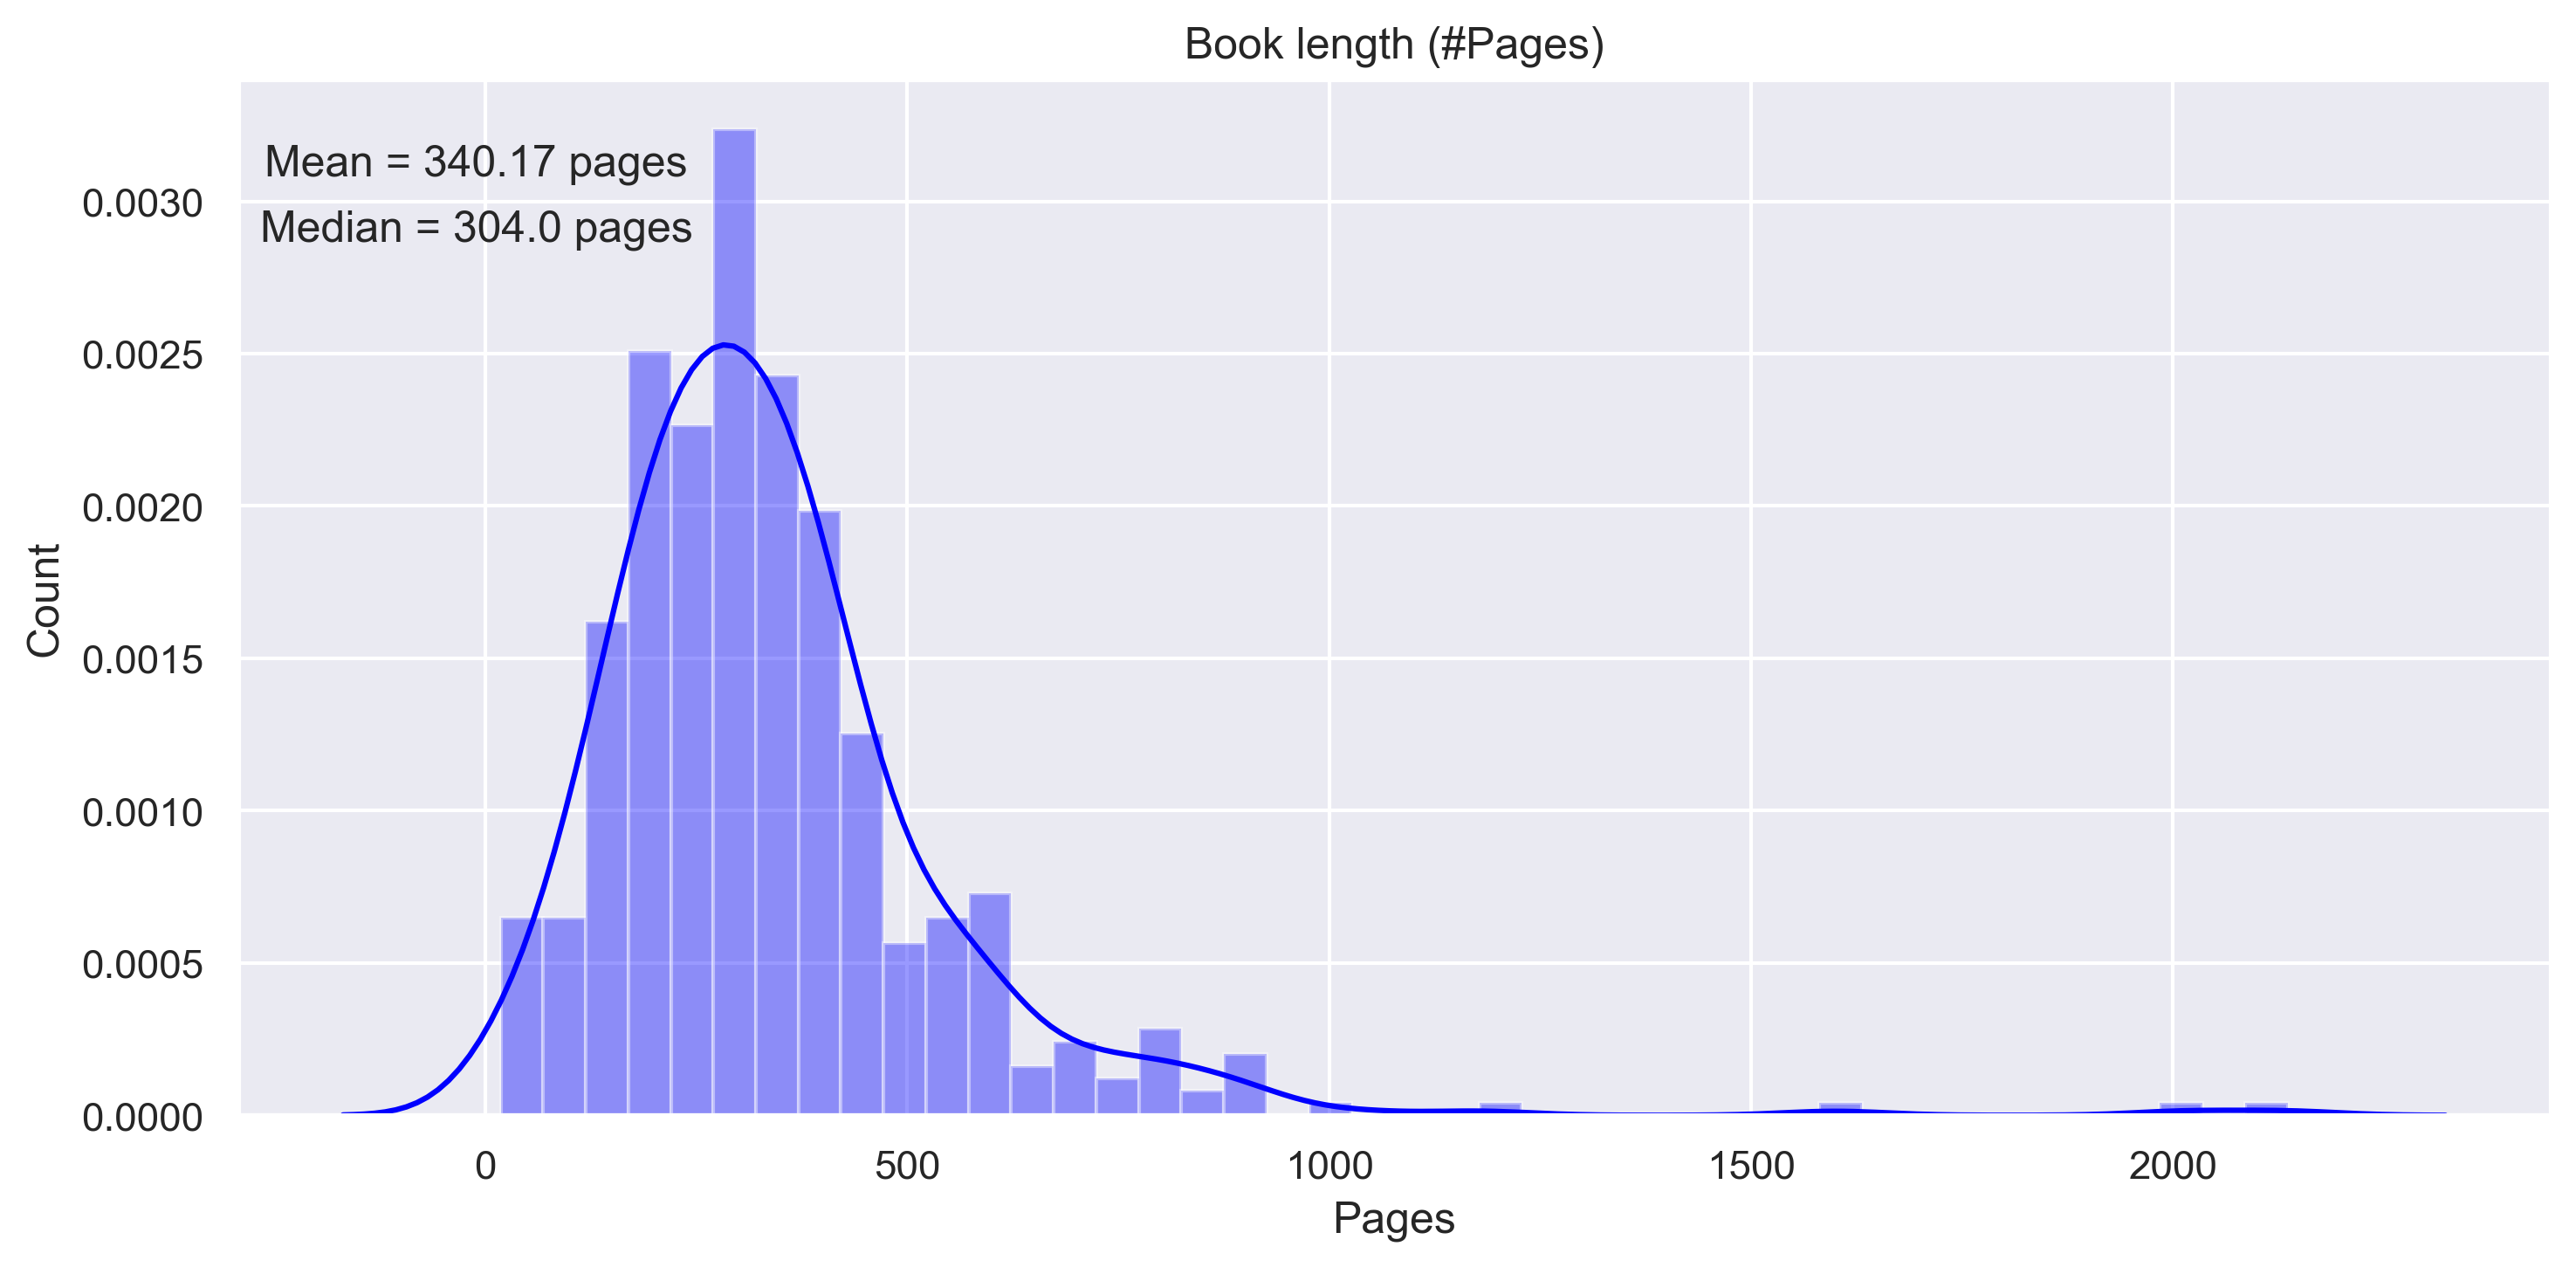
Finally, and least surprising, my books are on avg 300–350 pages long. The mean is of course heavily influenced by (1) the bible and (2) Swedish law book.
I wonder if book lengths have changed drastically over time? Only problem is: 11 years of data is not enough, my book purchases are not representative of “books” in general, year published does not equal my edition’s year or the year I bought the book, and, lastly, I should get some rest and call it a day.
As usual, I love exploring my life with data! And it is beautifully flawed, skewed, and with non-random measurement errors, and all the rest. One day, I’ll merge all my datasets capturing different aspects of life on date, and it will be absolutely marvelous. Until then, take care and see you on the next BUS!
Uploaded 2023–12–21; Last updated 2023–12–21
6 Exploring ASSA 2024
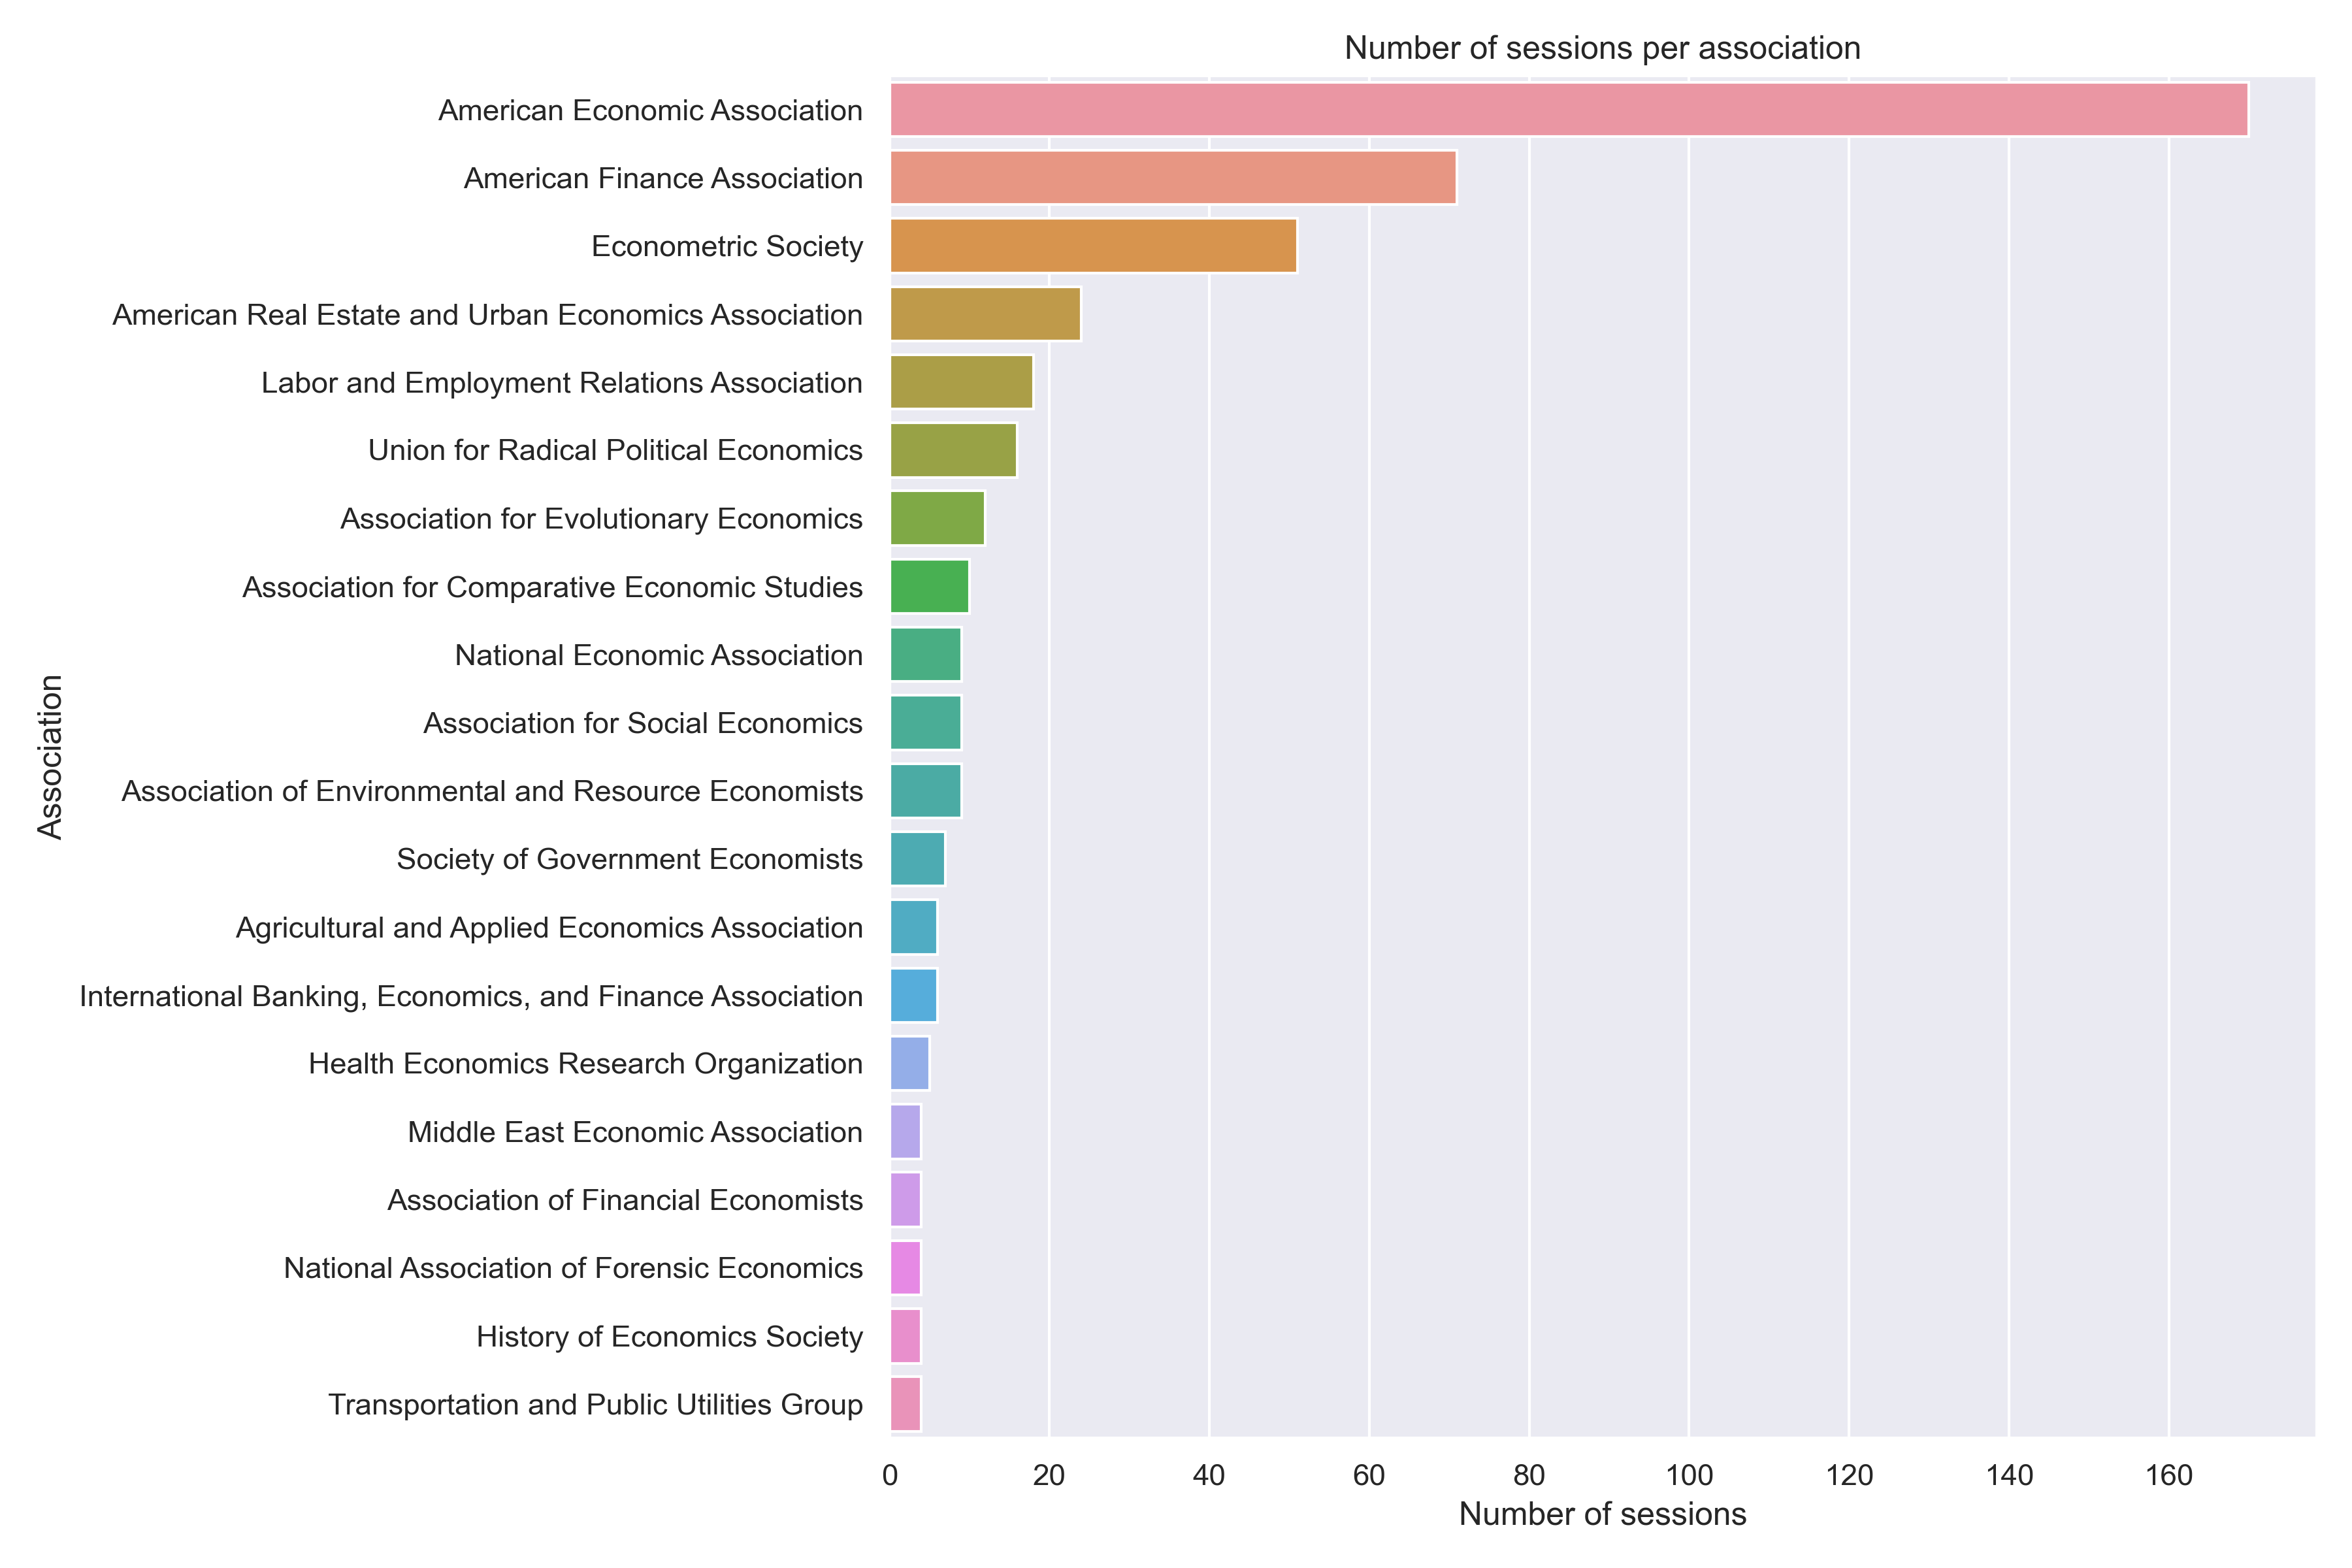
Started off this fiscal year by attending the Allied Social Science Associations’ (ASSA) annual meeting. This conference gathers around 70 associations and has poster sessions, over 1800 presentations, and events all concentrated in a period of three days. Coming back home from this conference, I was still overwhelmed with the sheer scale of it. So, I started exploring some data from the conference program as posted on their website (https://www.aeaweb.org/conference/2024/program)
First, the biggest association represented in ASSA, as measured by count of sessions hosted by this association is the American Economic Association (AEA). The (not so close) second largest association is AFA. The figure below shows the top 20 assocations.
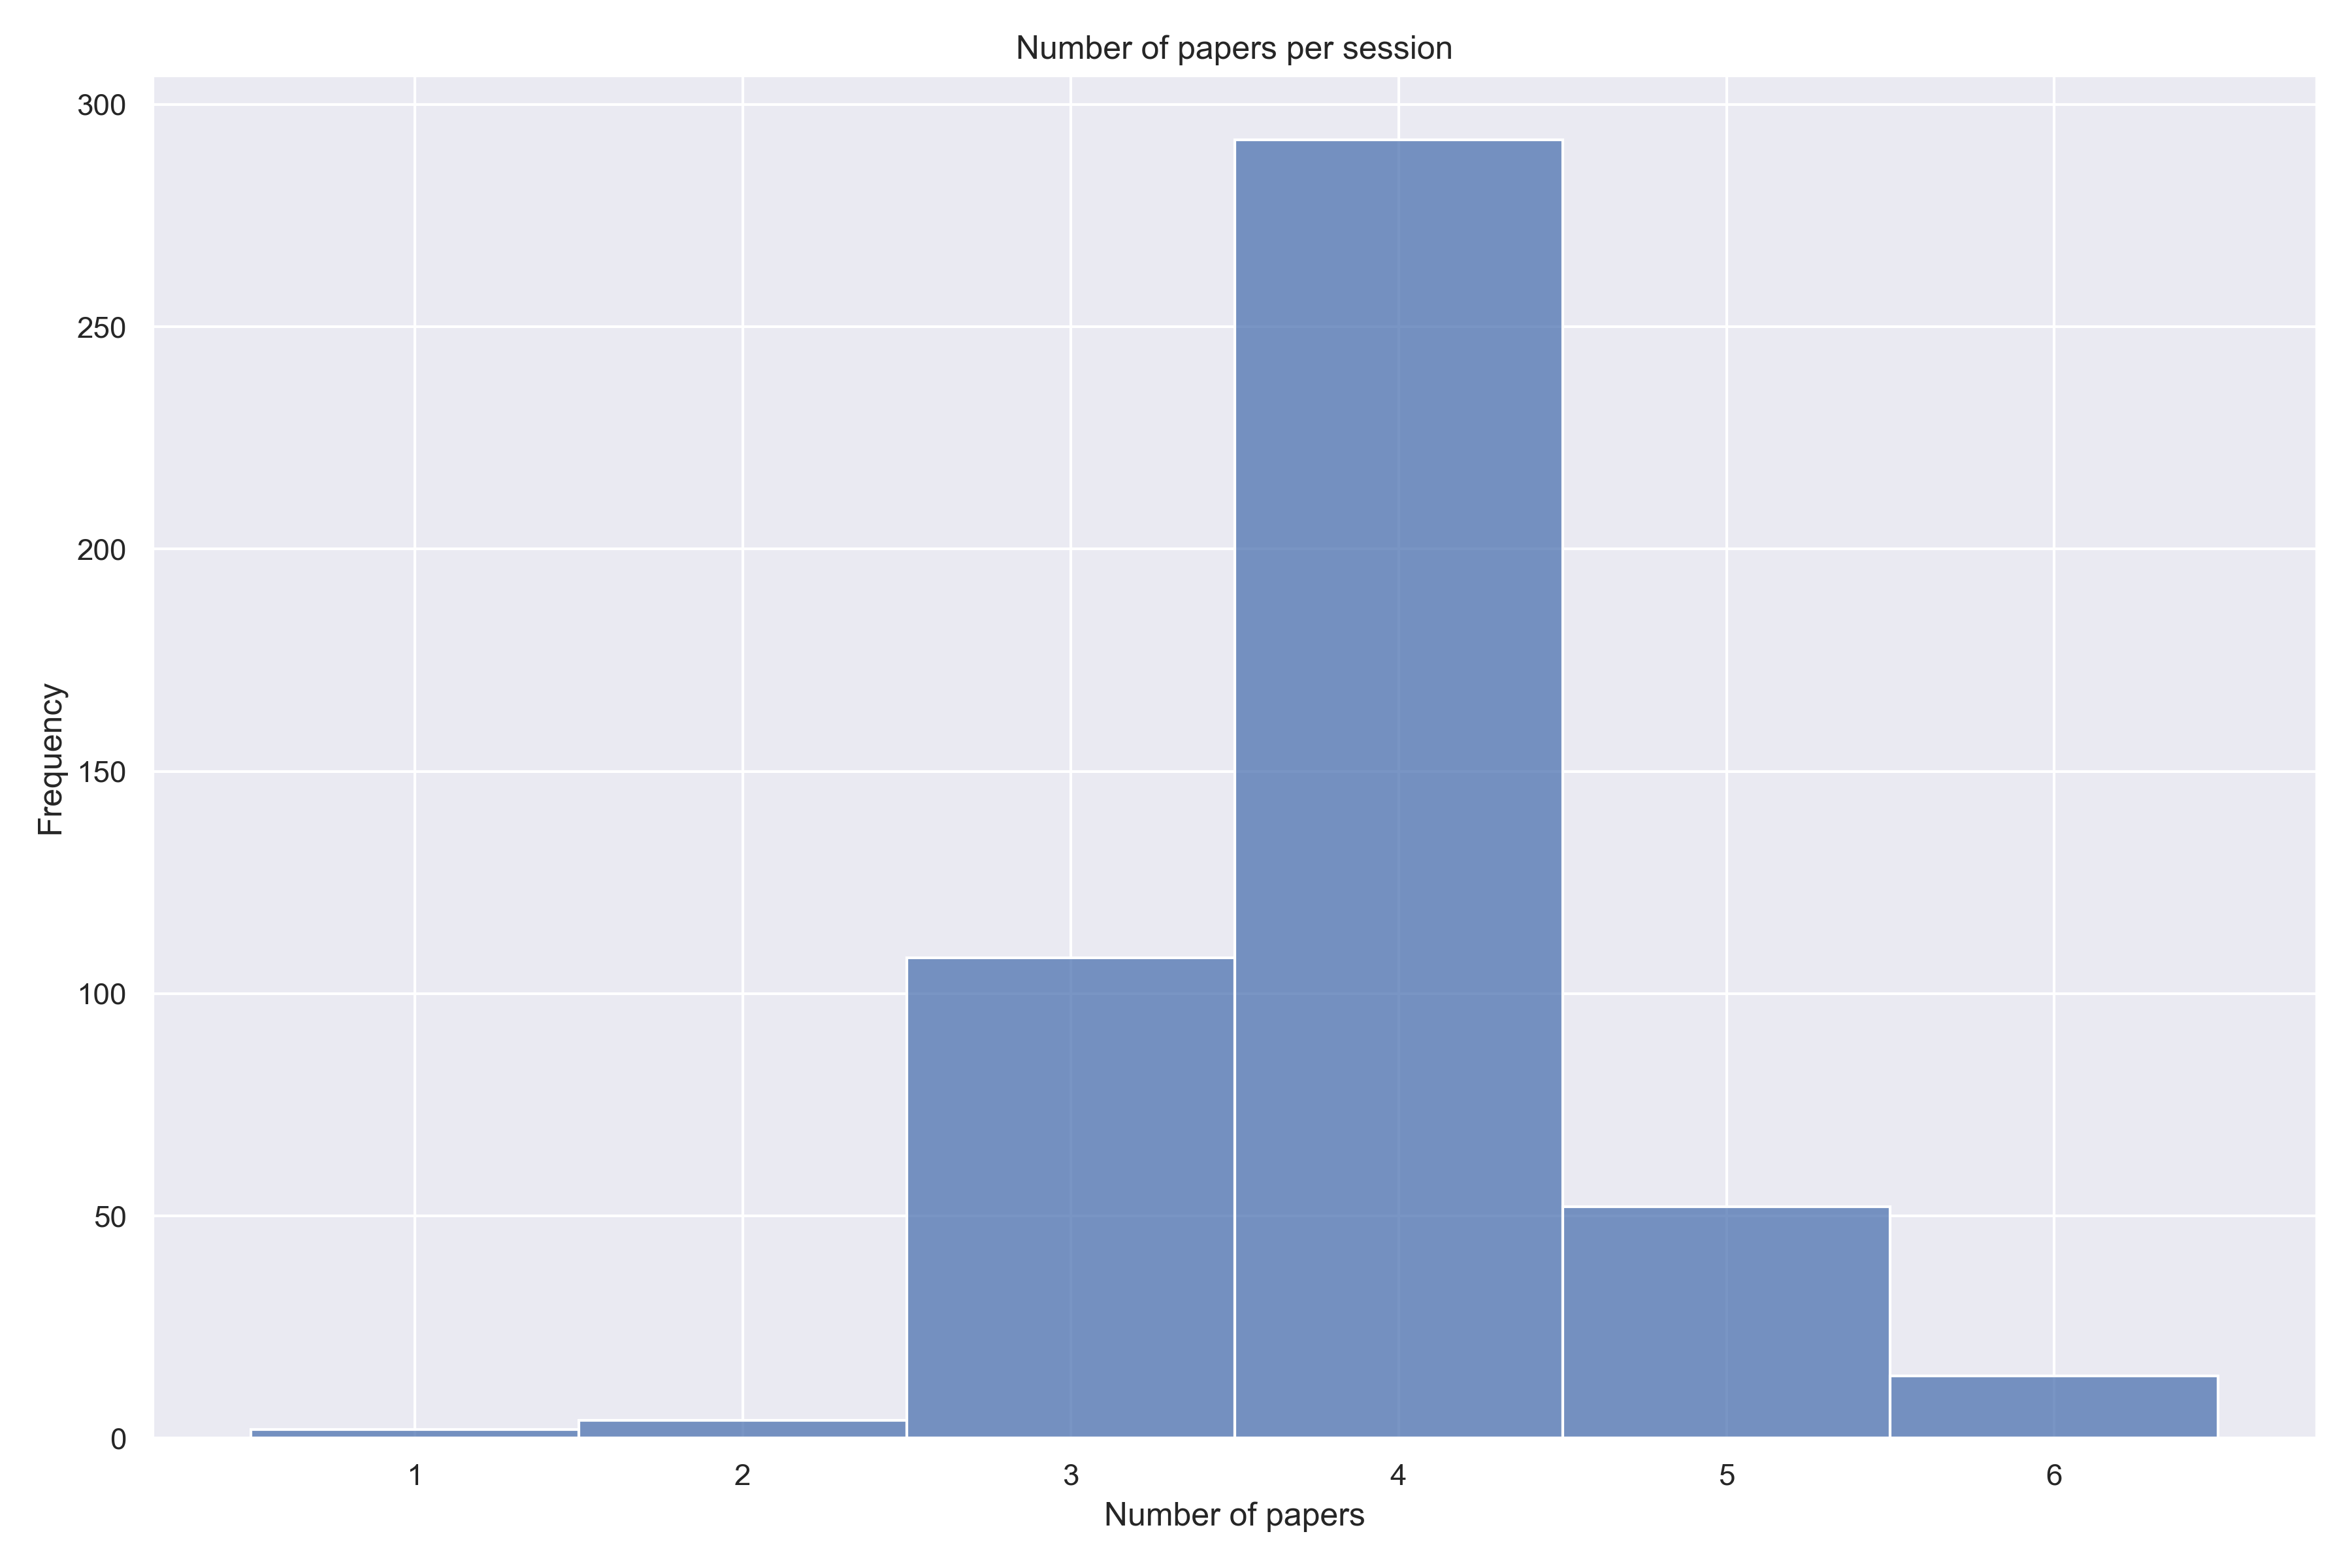
Each session has on average around 4 presentations.
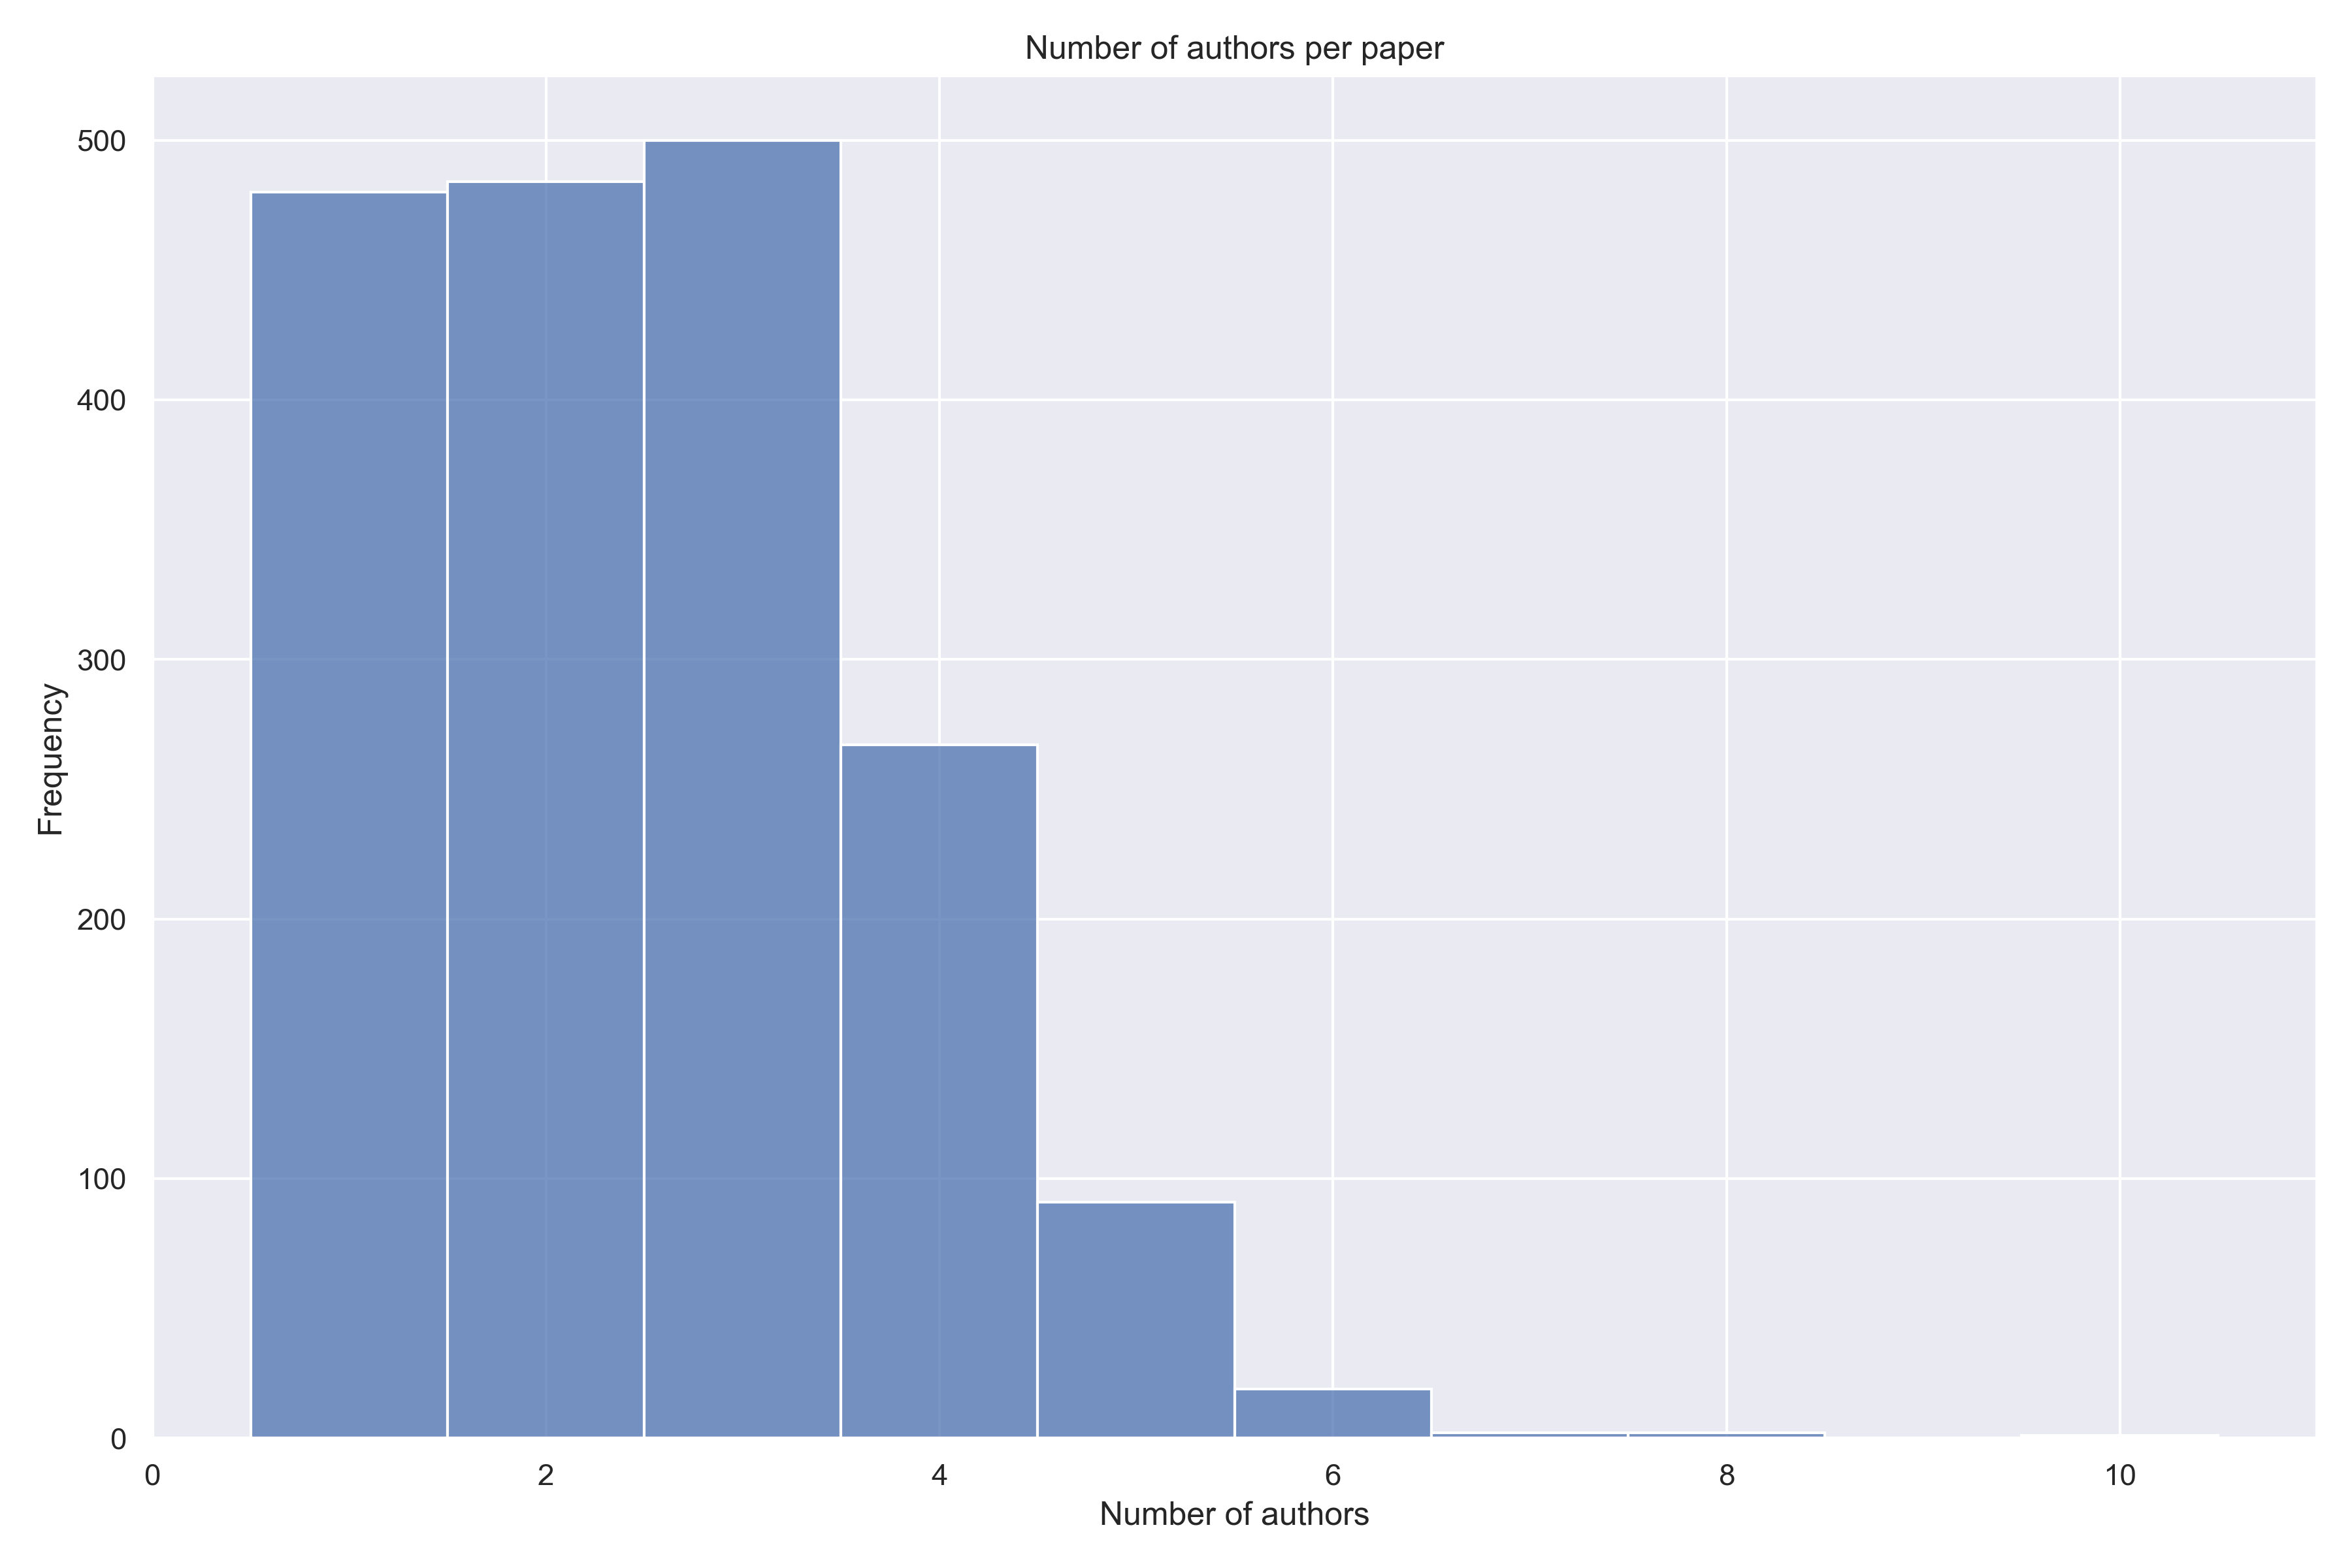
These papers had on average 2.5 authors per paper. A substantial difference between the number of papers with 1–3 authors, and 4 authors (almost half as many).
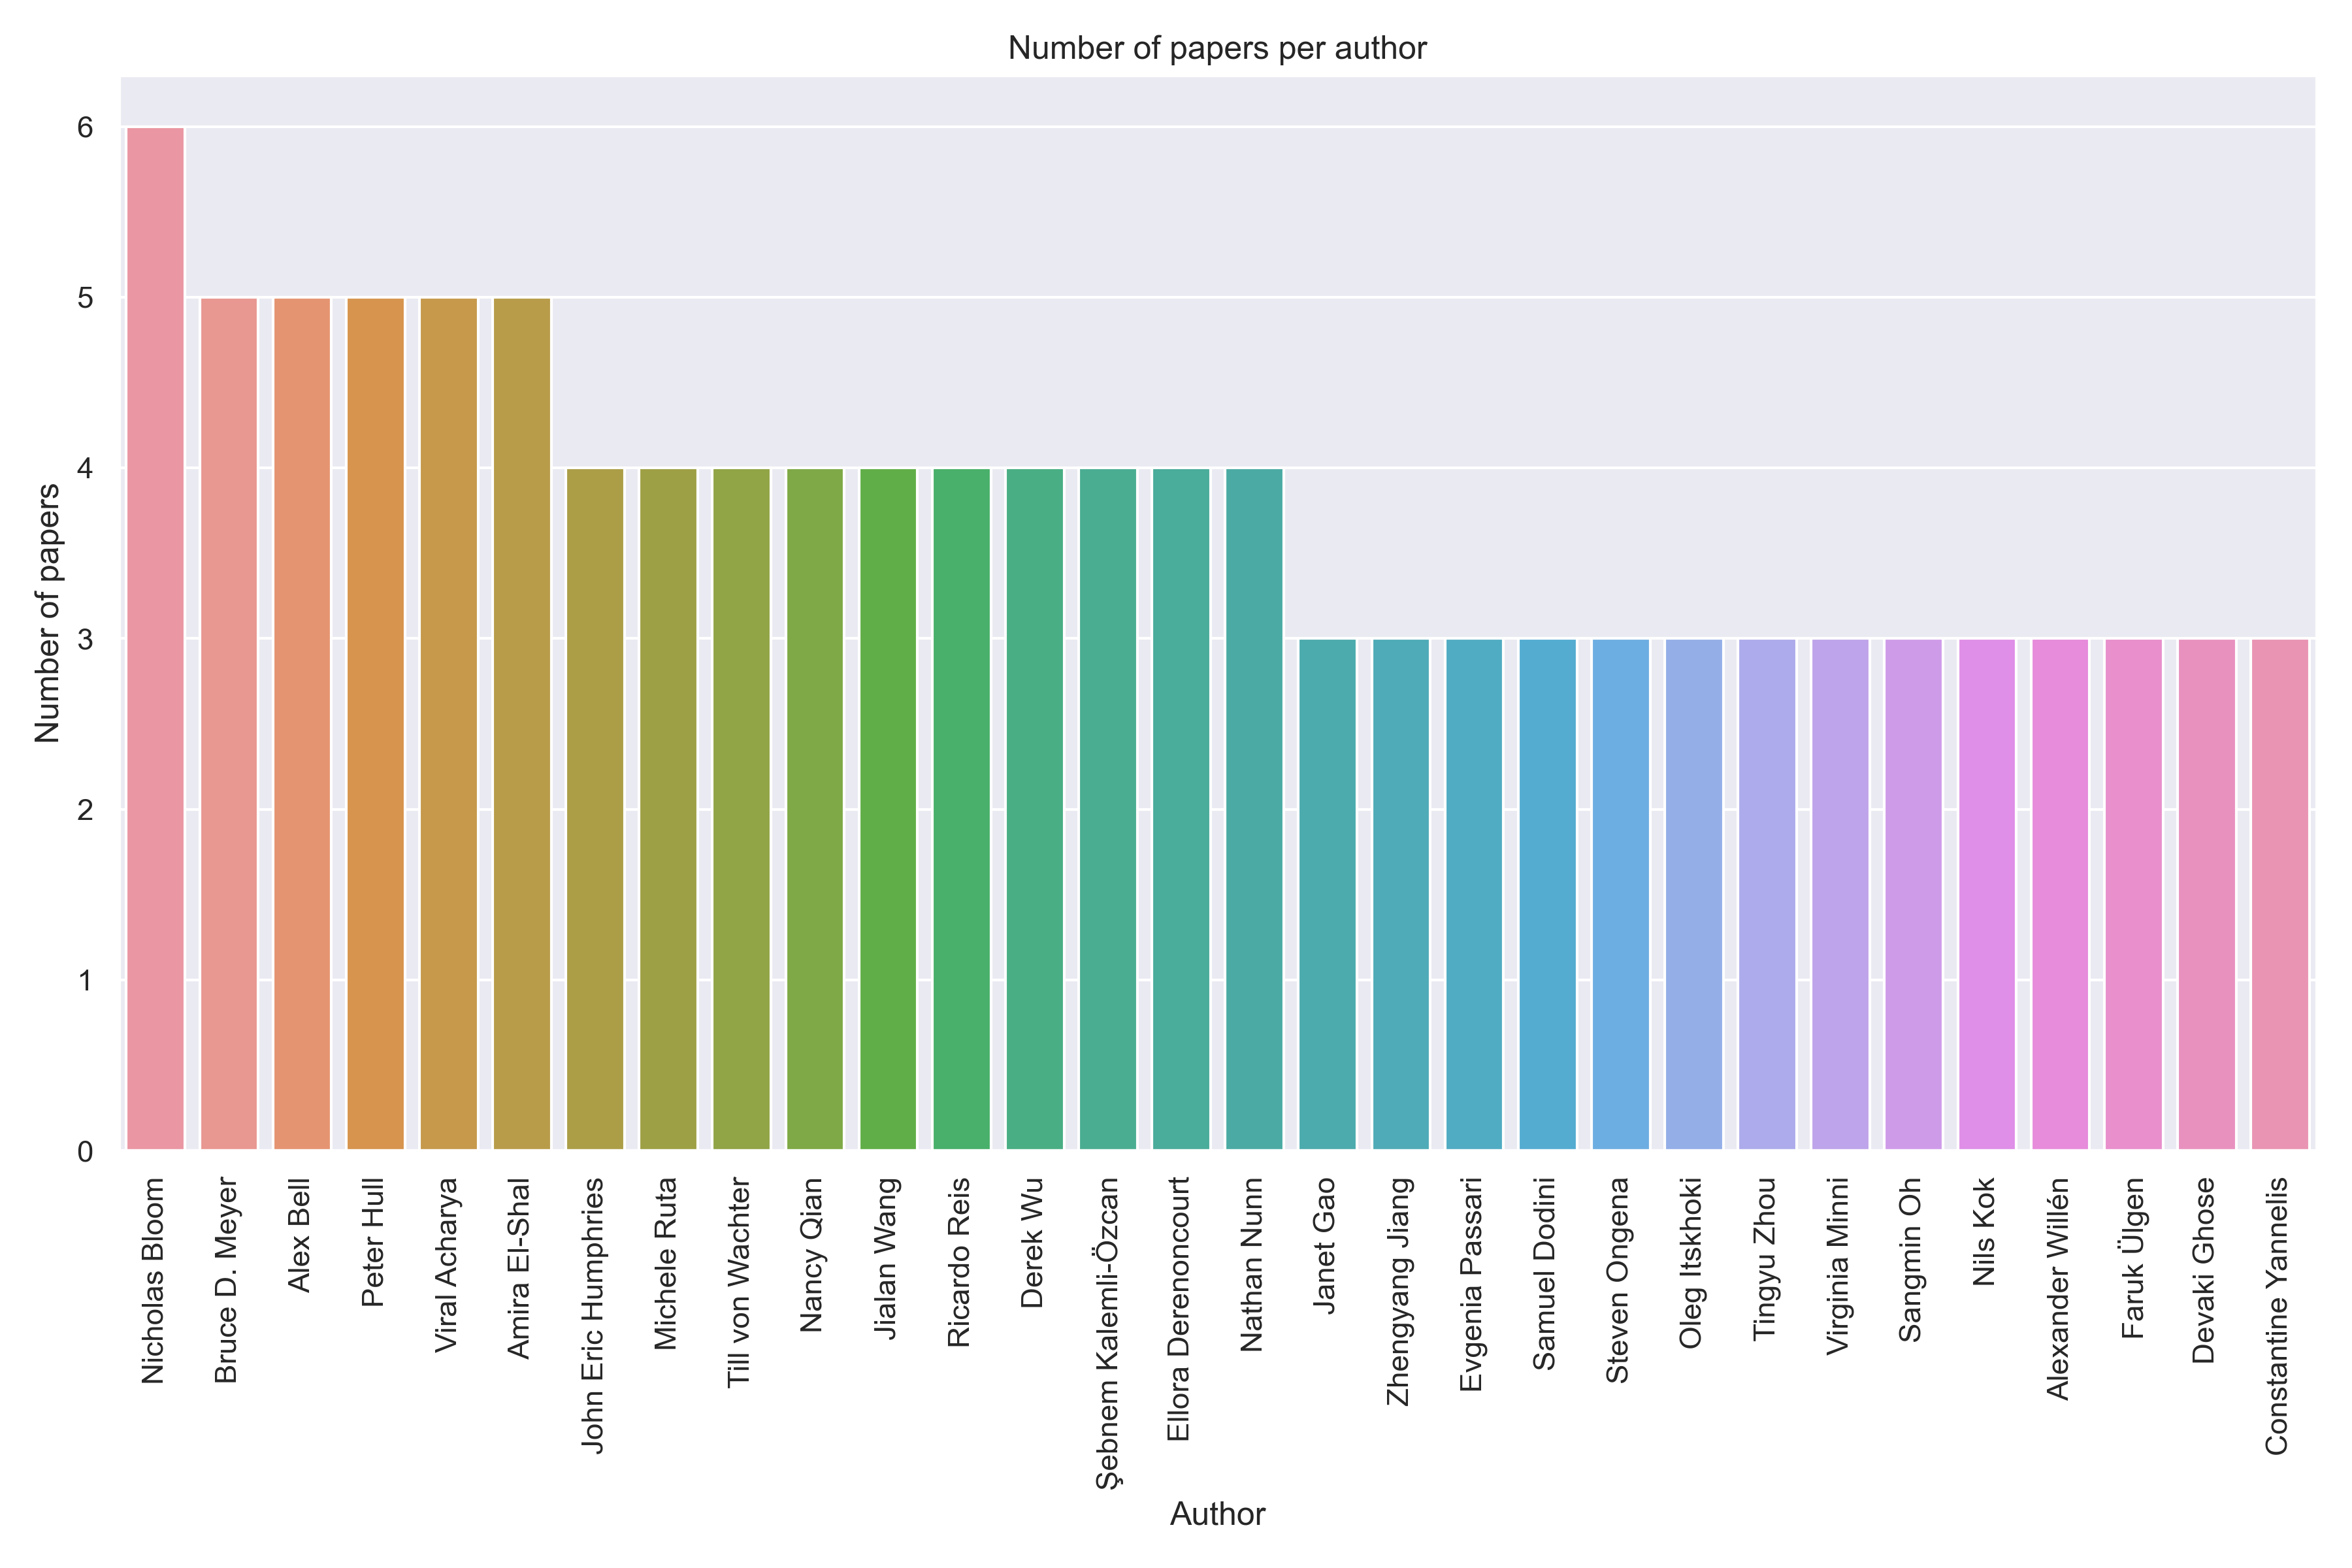
Some researchers were a part of the author team for several papers or presentations—and they are:
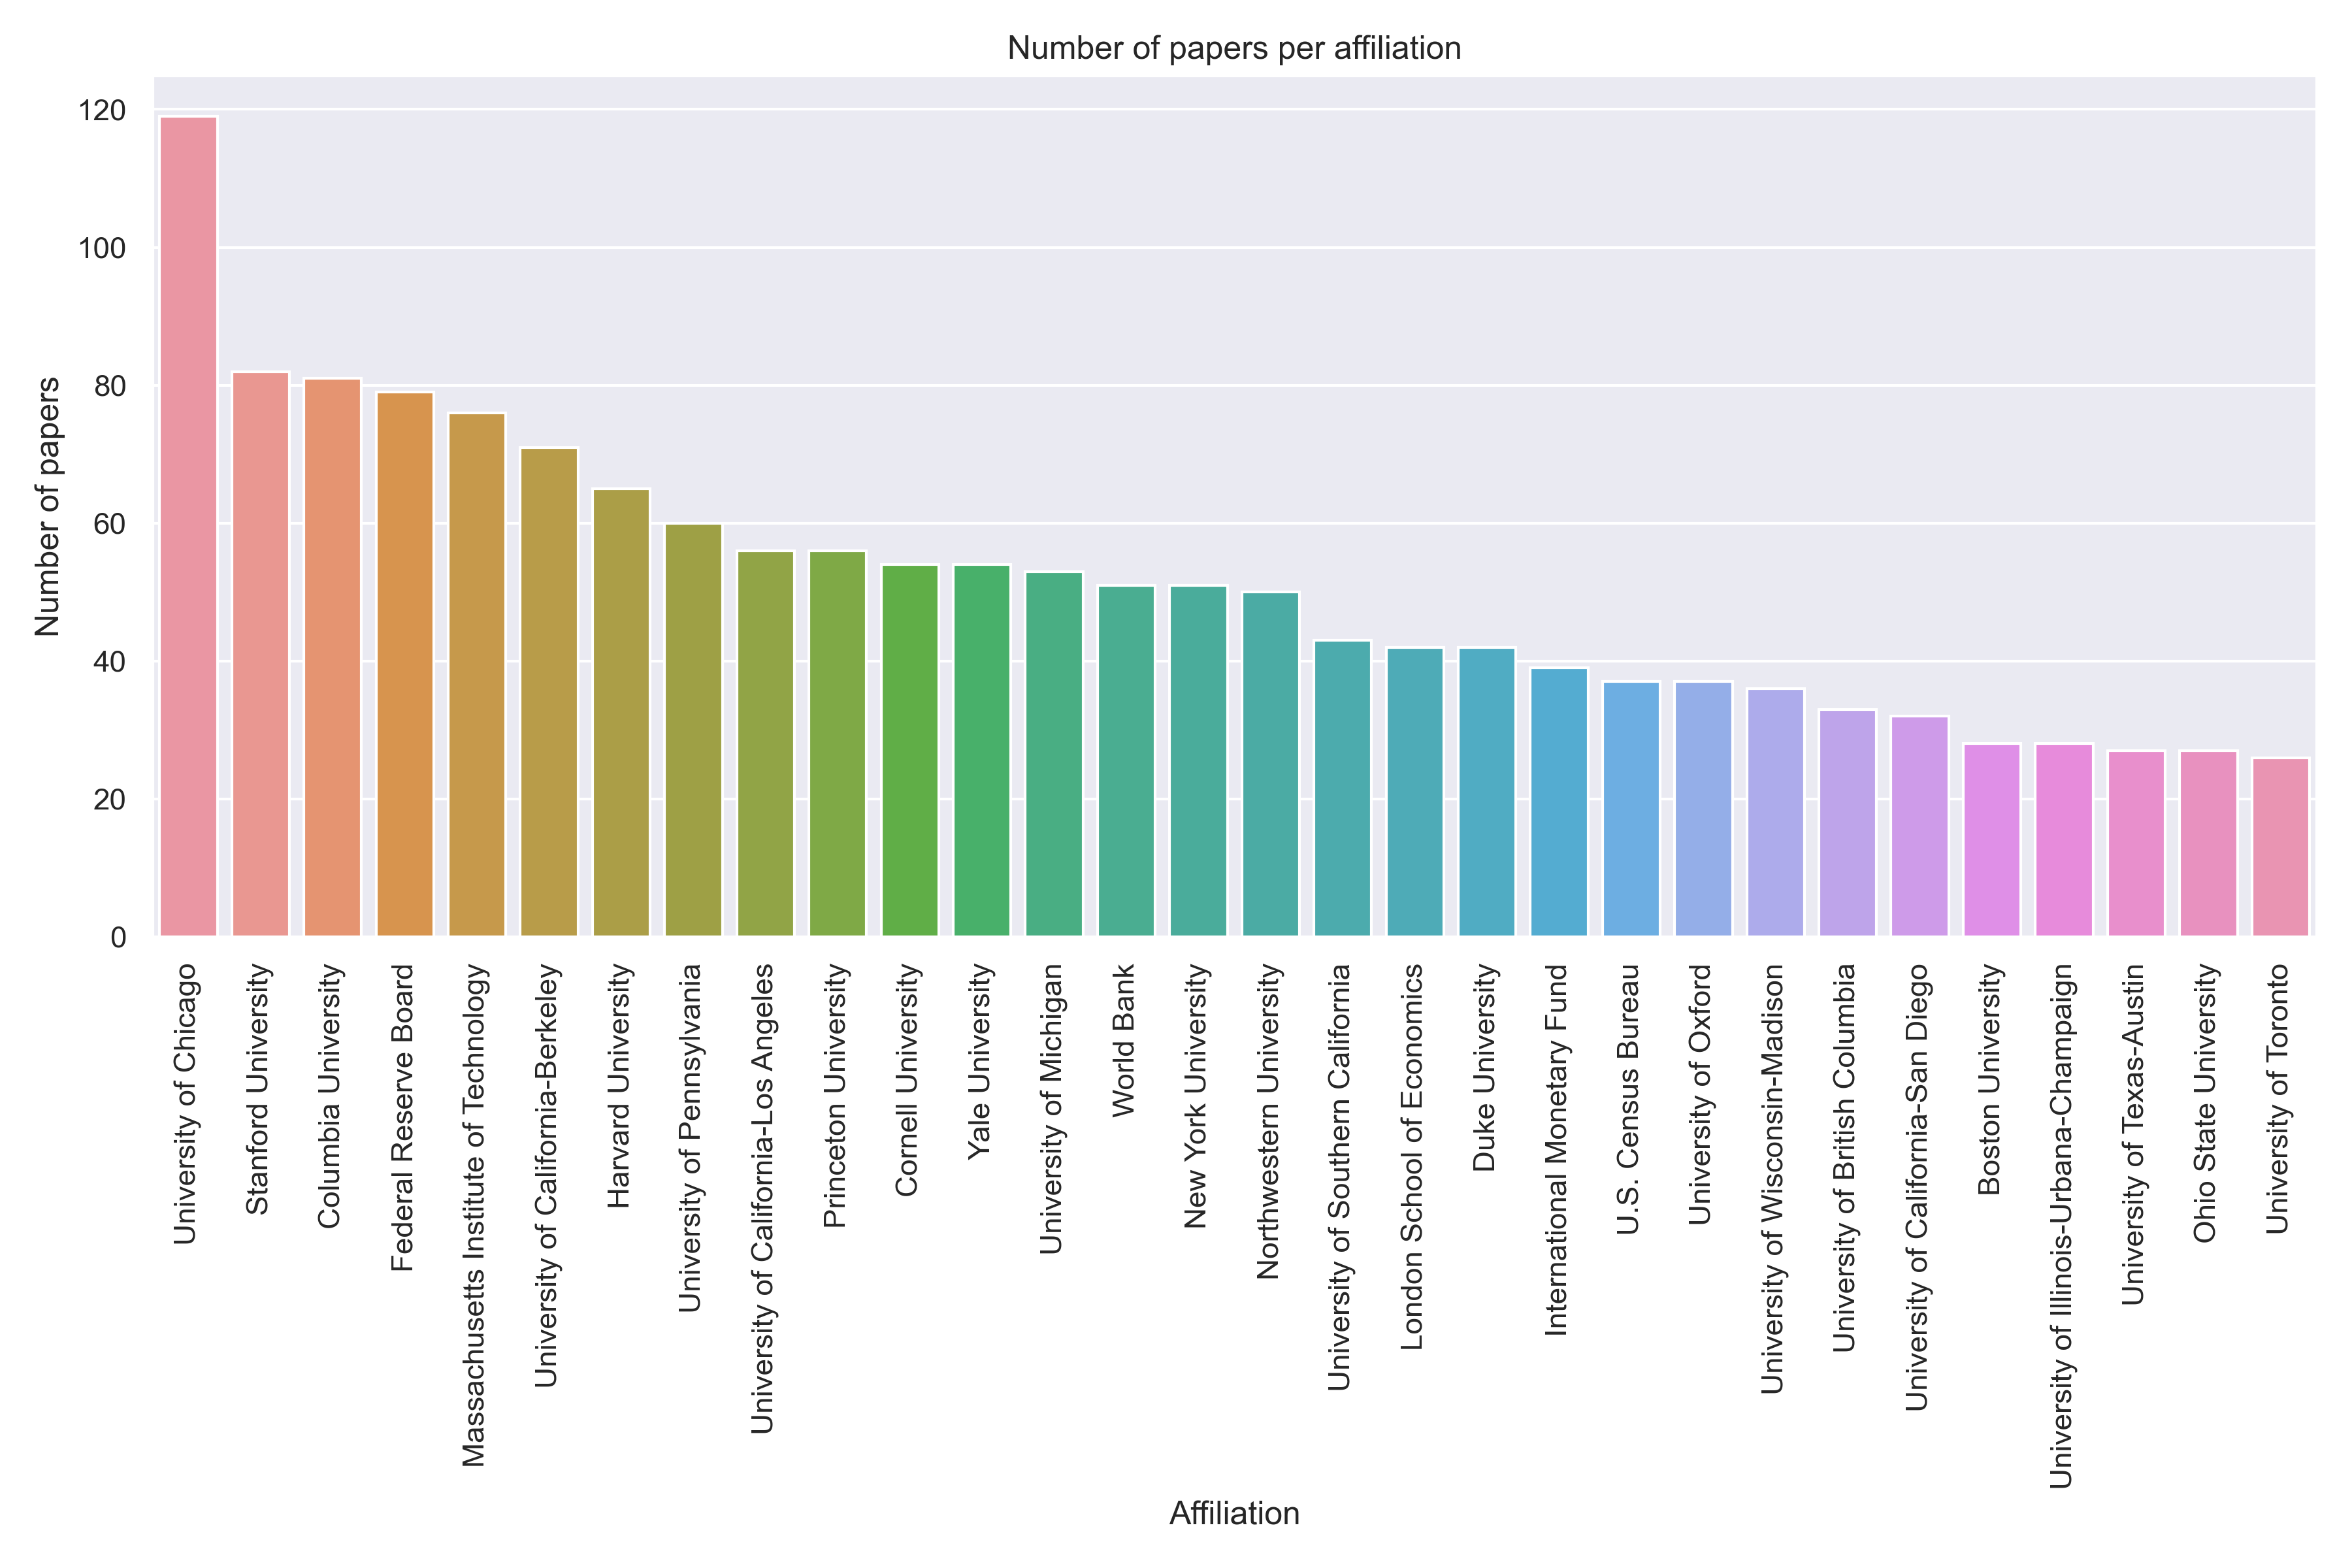
Researchers whose names are listed as authors to papers presented at the conference—where are they affiliated?
The top 30 institutes represented at the conference come as no surprise. Chicago, Stanford, Columbia, the Fed, MIT and UC Berkeley are on top. (I had to count the top 6, not top 3 or top 5, to include Berkeley…)
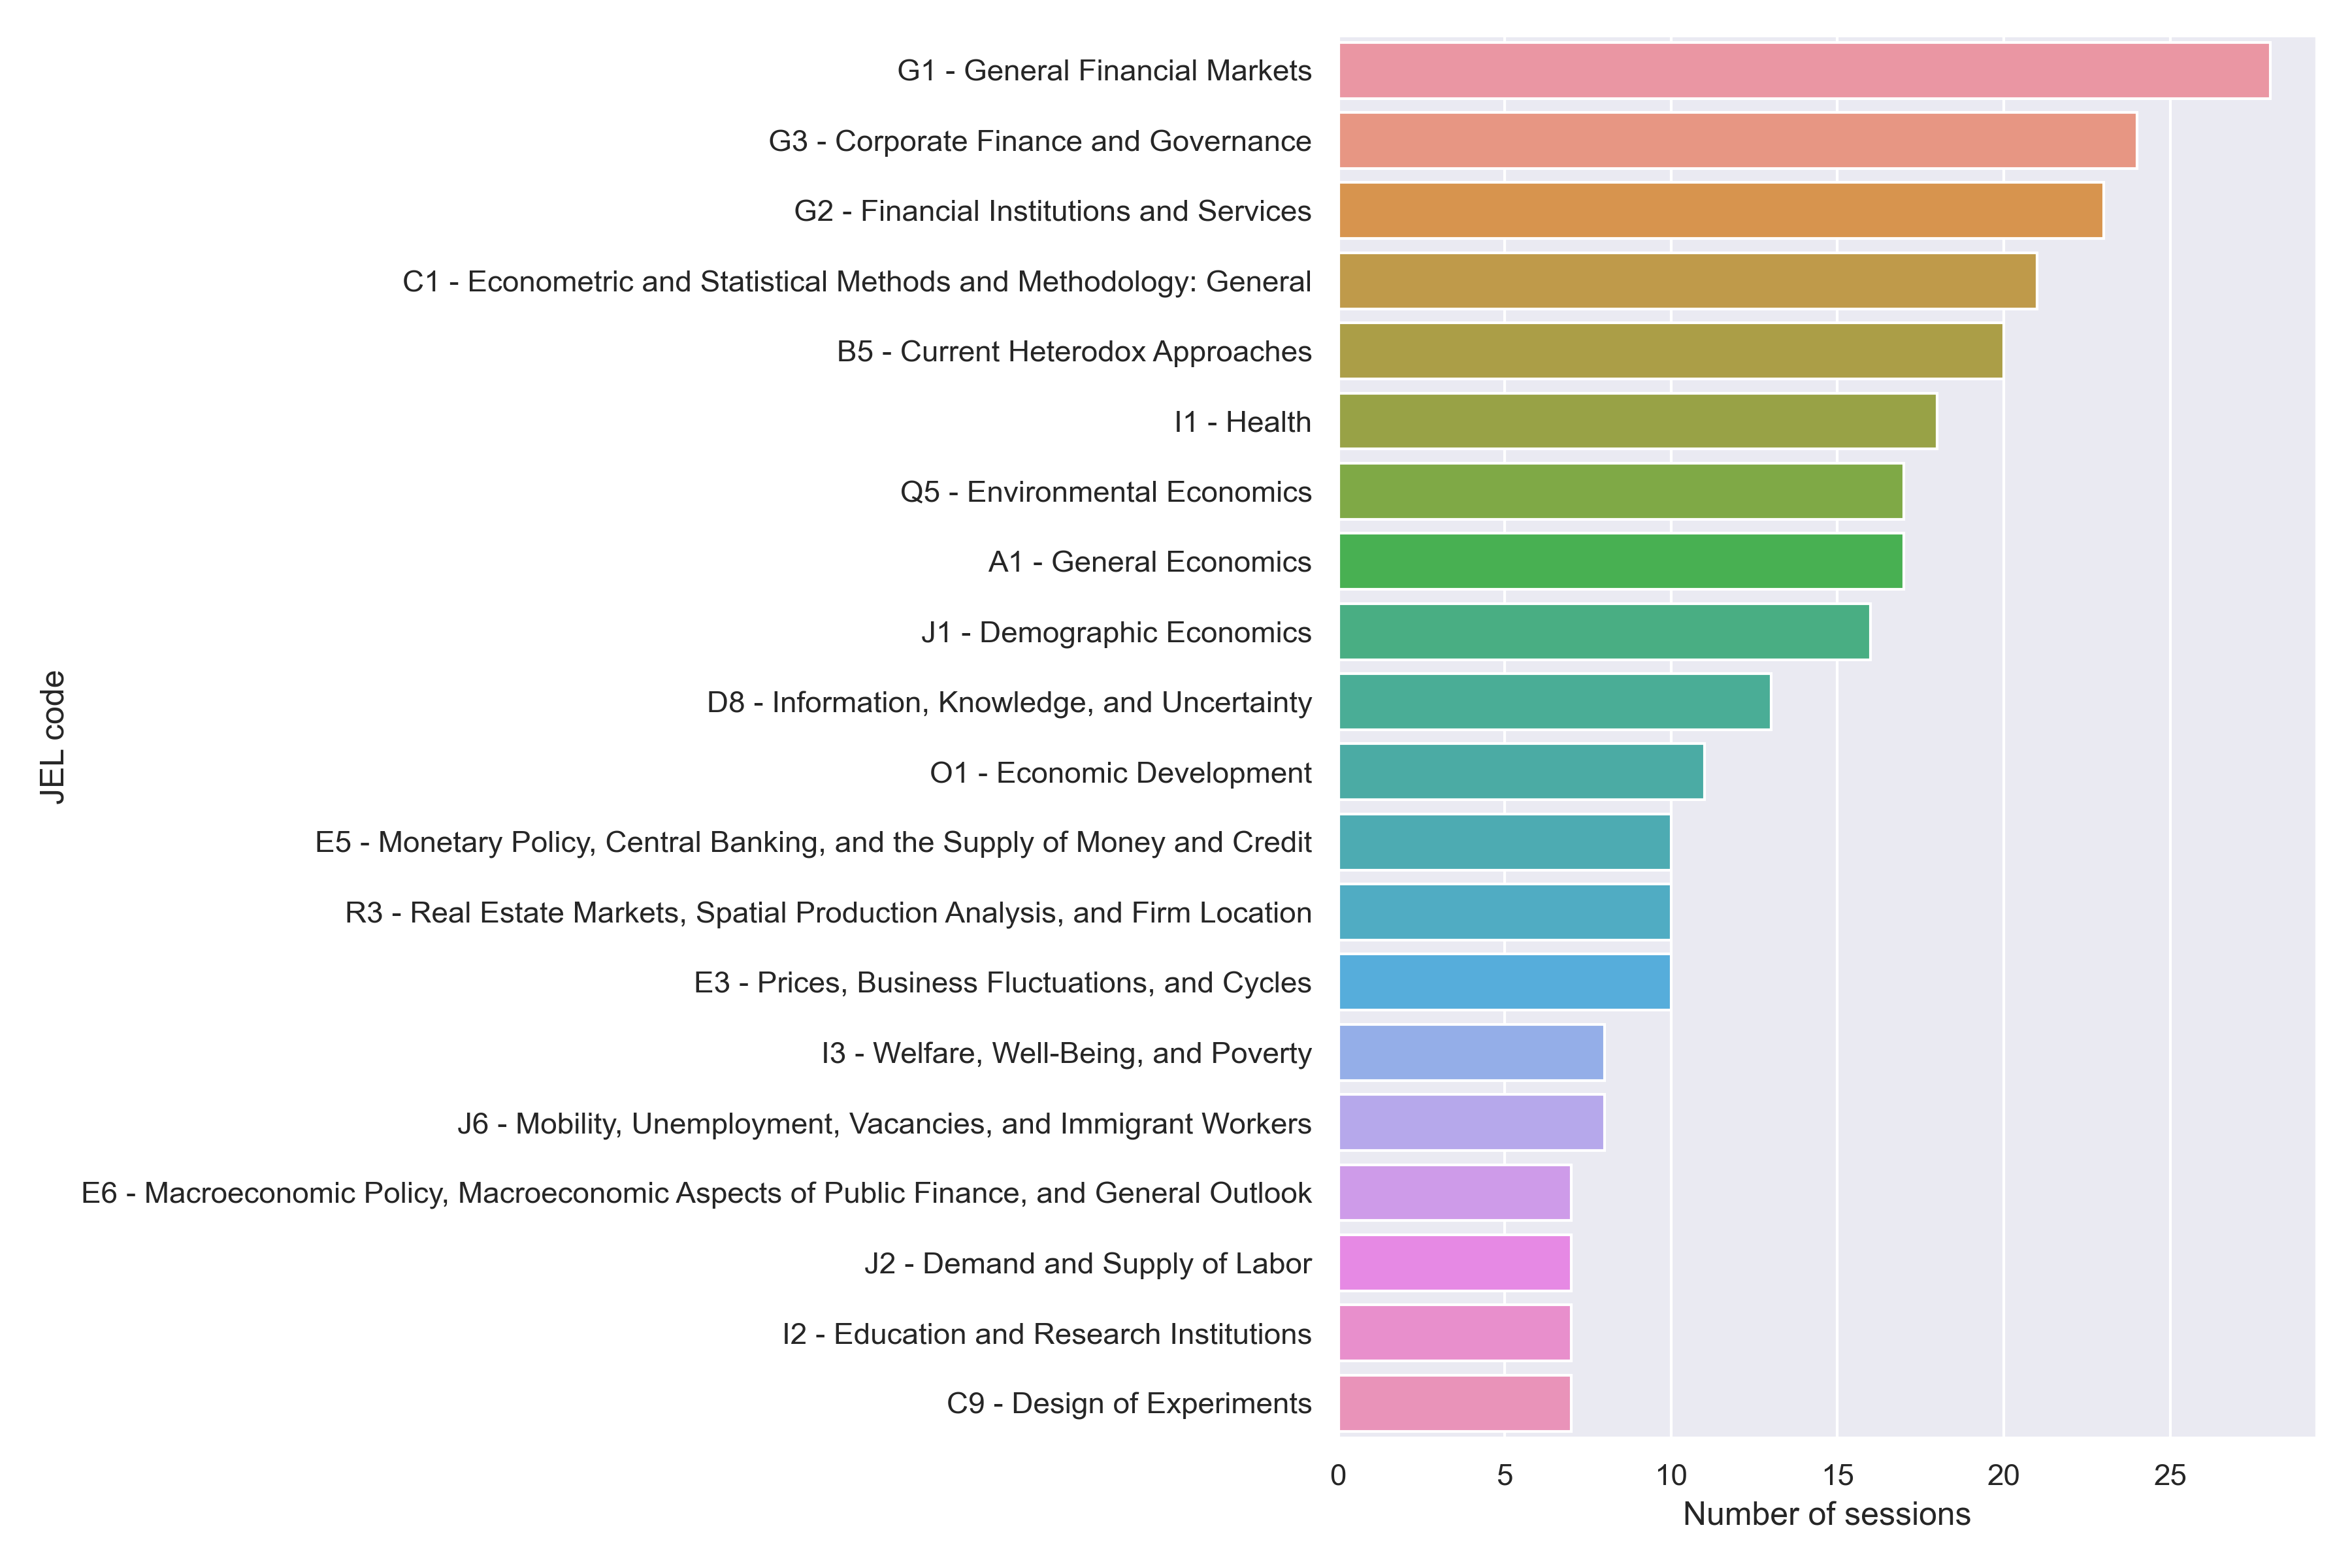
So, which topics were discussed at the ASSA 2024? Based on JEL classifications for sessions, there was a lot of finance, followed by econometrics, and then specific topics (such as health, environmental, and demographic). The top 30 JEL codes are:
The ASSA was a great opportunity to explore different topics and meet new people. My personal preferences are for smaller conferences, because you actually get the chance to attend almost everything and to greet almost everybody. Here, of course, that is impossible.
Uploaded 2024–01–18; Last updated 2024–01–18
7 Exploring my car expenses
Are you ever confronted with the thought of how much it actually costs to own a car? Well, I did, and I had to find out.
For a period of approximately 6 years, between 2016 and 2022 (specifically, 2 269 days), I saved all receipts related to my car. Everything from the down payment, petrol, parking to parking violation tickets, annual service and ferry boat tickets.
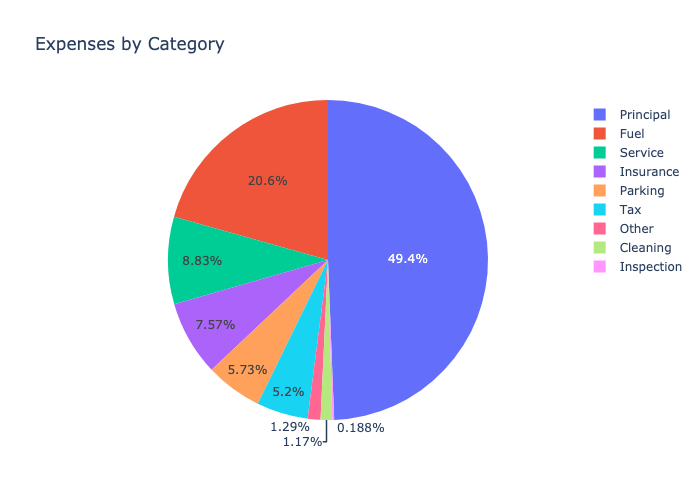
First, a breakdown of my expenses by category. Around half of all car expenses went to paying for the actual car, followed by fuel (20%), servicing (9%), insurance (8%), and parking (6%). The rest is taxes, car washes, motor vehicle inspection and miscellaneous.
Zooming in on the parking expenses over time, I have 433 recorded parking occations. In July of 2018 I moved back home to Stockholm and used the car much more, and it seems like my parking expenses increase a lot during summers. In late spring of 2020, I avoided public transportation by carpooling to work with my sister. I have no recollection of what happened in January of 2022, but there sure was a spike in activity there.
There are some main players that provide solutions for parking payments in Sweden. The firm Easypark allows for paying in streetparking everywhere in Stockholm and in select garages. Basically, they take a fee for every transaction through the app, but you can extend or shorten the parking duration which either (1) saves you money by only paying for the time you use or (2) saves you effort by not having to run to the car to extend the parking duration. So, Easypark is the parking firm that I have interacted with the most.
As I write this, fuel prices are down to 18 SEK/L (6.5 USD/gal). This is a very decent price. For the period where I have receipts, the maximum price was 23.73 SEK/L (8.5USD/gal) and the minimum was 11.89 SEK/L (4.3 USD/gal)
If I compare my fuel prices versus a national average, I more often than not fuel up at a price slightly lower than the national average daily price.
My cumulative fuel consumption in expenses and volume looks as follows. For my car, this total volume is equivalent to around 102 full tanks. On average, I fuel 32 litres per time, and my absolute maximum was 42.55 litres.
As a persion of habit, I will drive the extra mile (literally), to get to my favorite gas station. The gas chain Ingo is the second-closest to me when I live in Stockholm, but is always cheaper than the one that is closest, and is usually on my way in any case. When I lived in Uppsala, the cheapest gas station was St1.
I was recently asked why I gather statistics about my life and what pleasure, if any, I get out of it. These are all small challenges that I pose to myself, and I only take them seriously while I’m doing them. This project of analyzing car expenses is officially concluded, and now I look back at it with insight, wisdom and accomplishment.
At some points, I have to remind myself that the measurements are secondary to the actual activity. There is a real danger in optimizing measurements at the cost of living. Or to focus so much on measurements because they provide a sense of accompolishment that you forget that the underlying performance is the whole reason these measurmenets are possible.
I will always, first and foremost, live my life to the fullest. If I happen to record some of it, or try to understand it better, that is just a plus. Stay stats-freaky friends!
Uploaded 2024–02–16; Last updated 2024–02–16
8 Exploring my Instagram
How does my online behaviour change when as new chapters of my life start?
To answer that, let’s take a look at my Instagram data.
I look at four aspects of online behavior—likes, comments, posts and follows-and how they change as my academic and professional life changes.
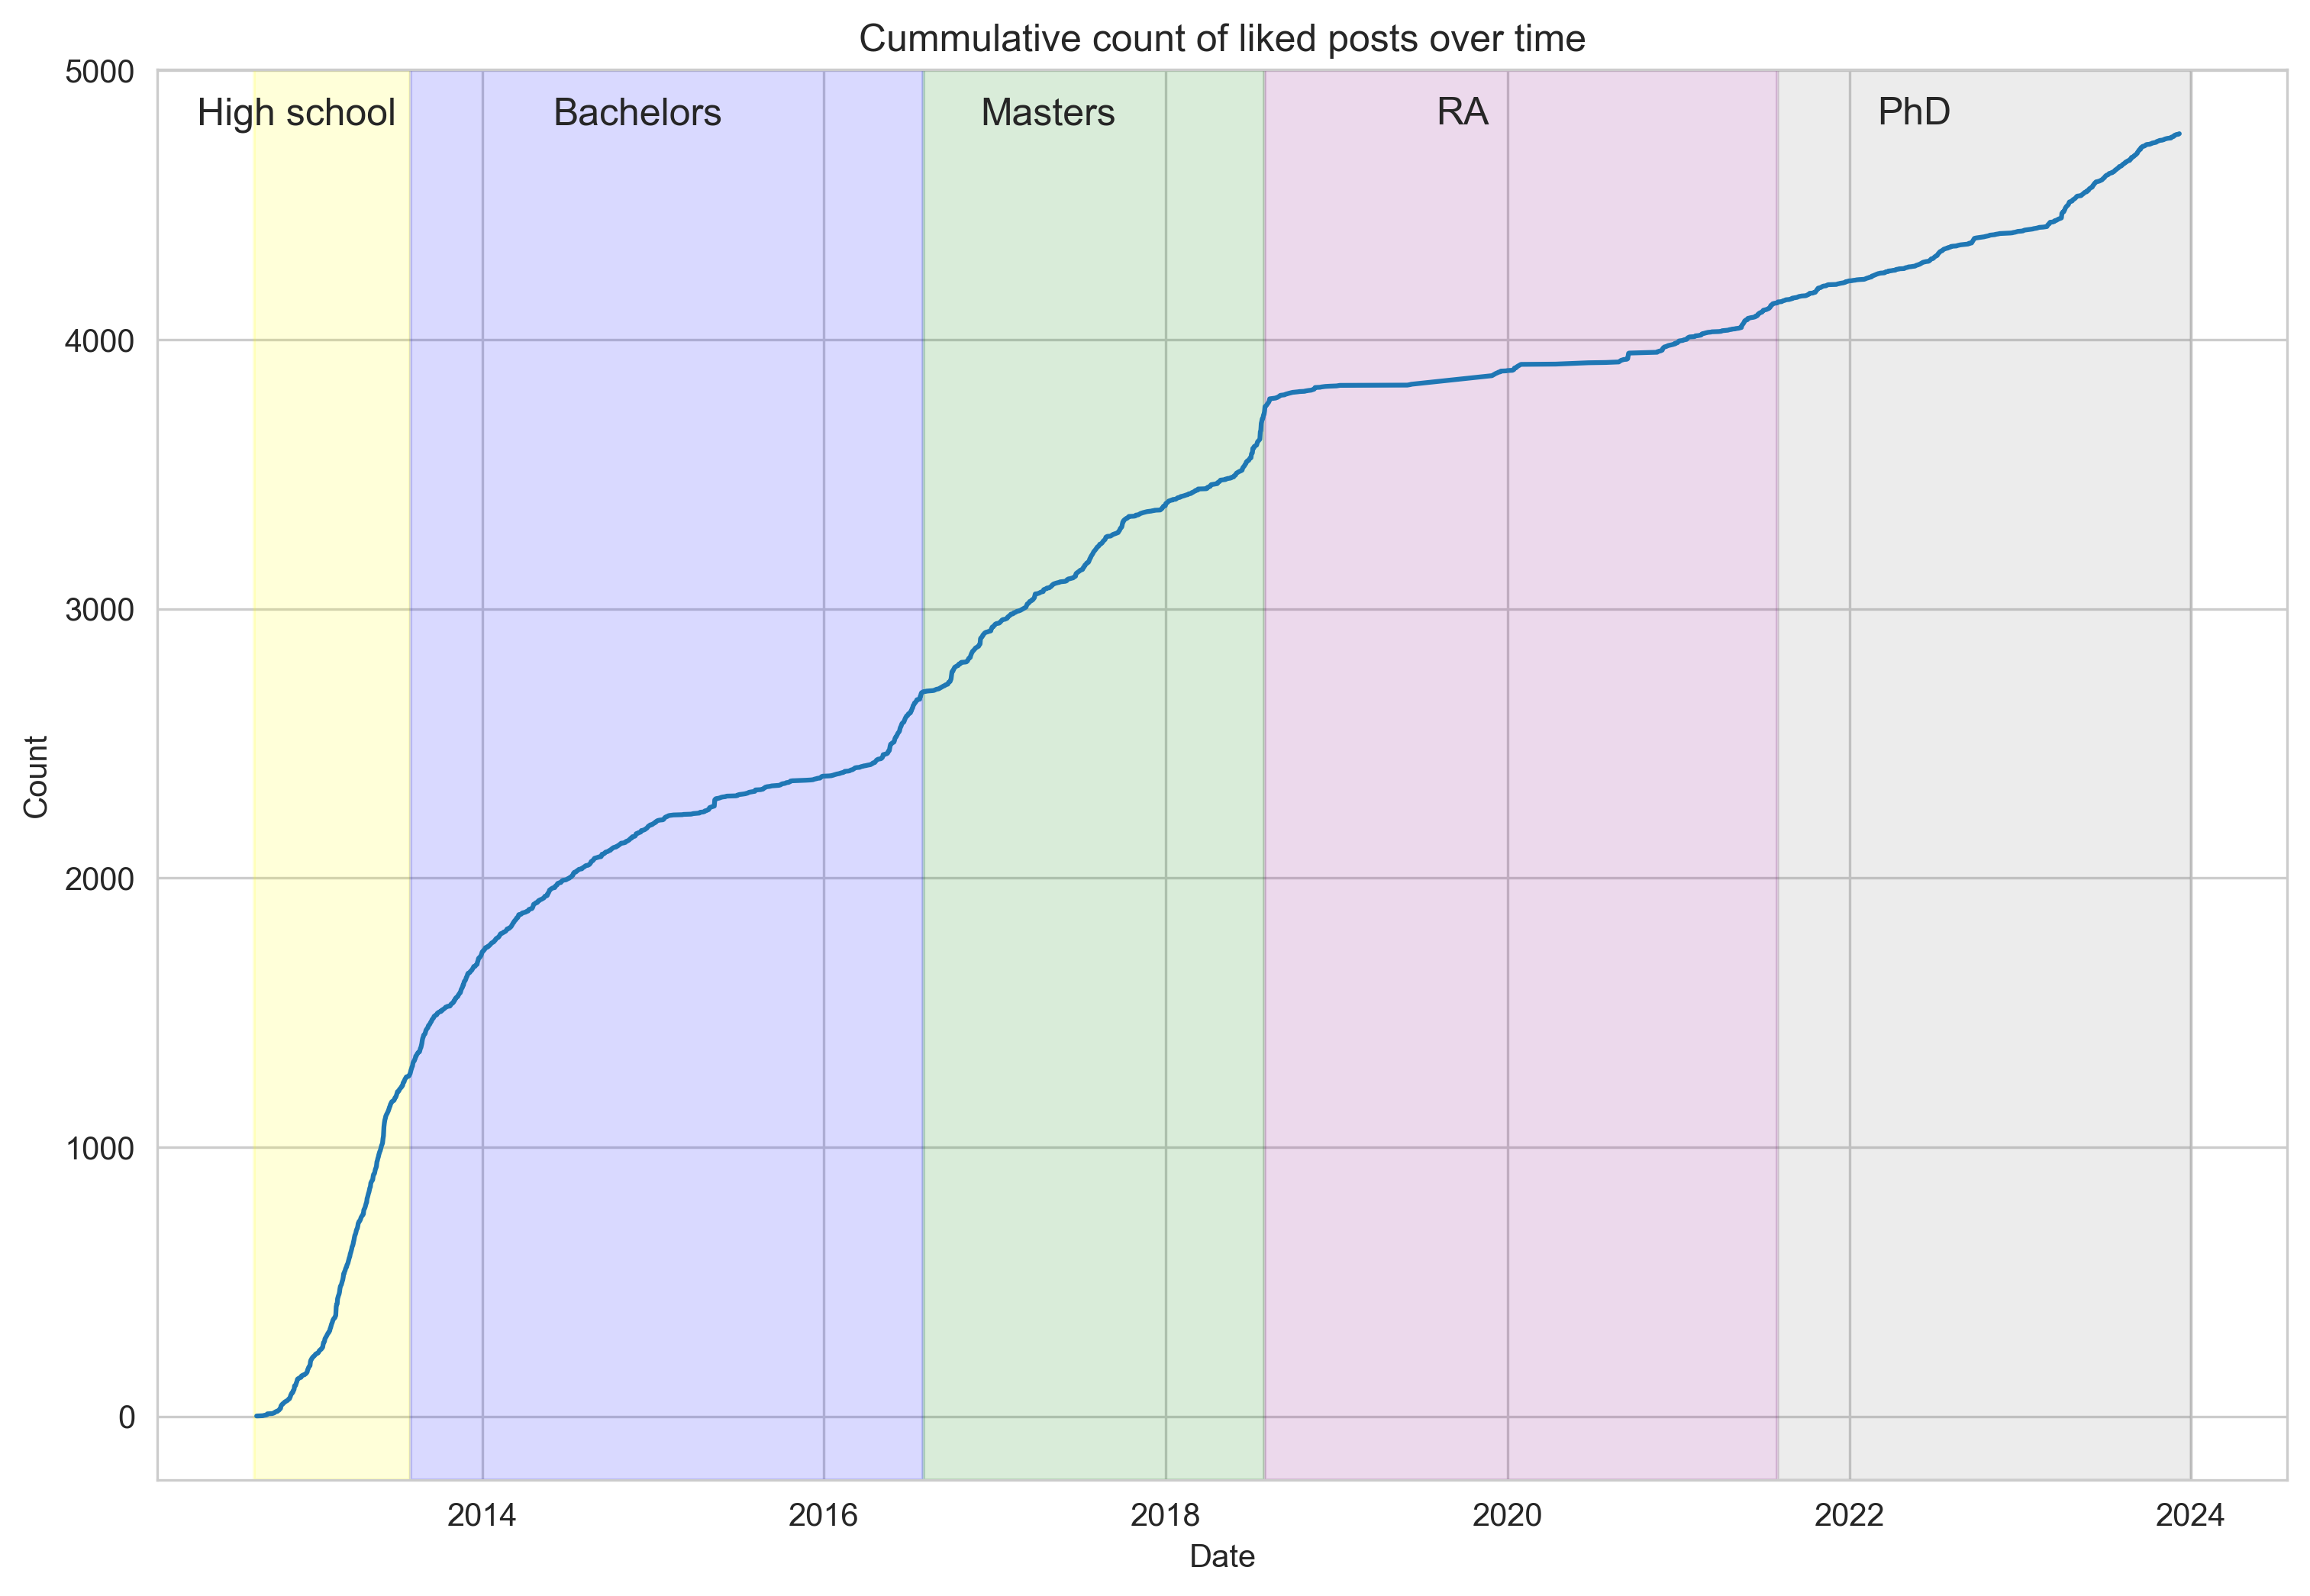
Likes
The number of likes follows an interesting pattern. At the end of each episode of life, I seem to like much more posts.
This is especially the case for finishing the bachelors and the masters studies. I attribute this to having been with a big graduating cohort
and everyone uploading their theses, or job announcements, or other big announcements that naturally follow completing an academic degree.
It’s also telling that the increase in likes is not as pronounced at the end of my RA-ship, as it was a much smaller cohort.
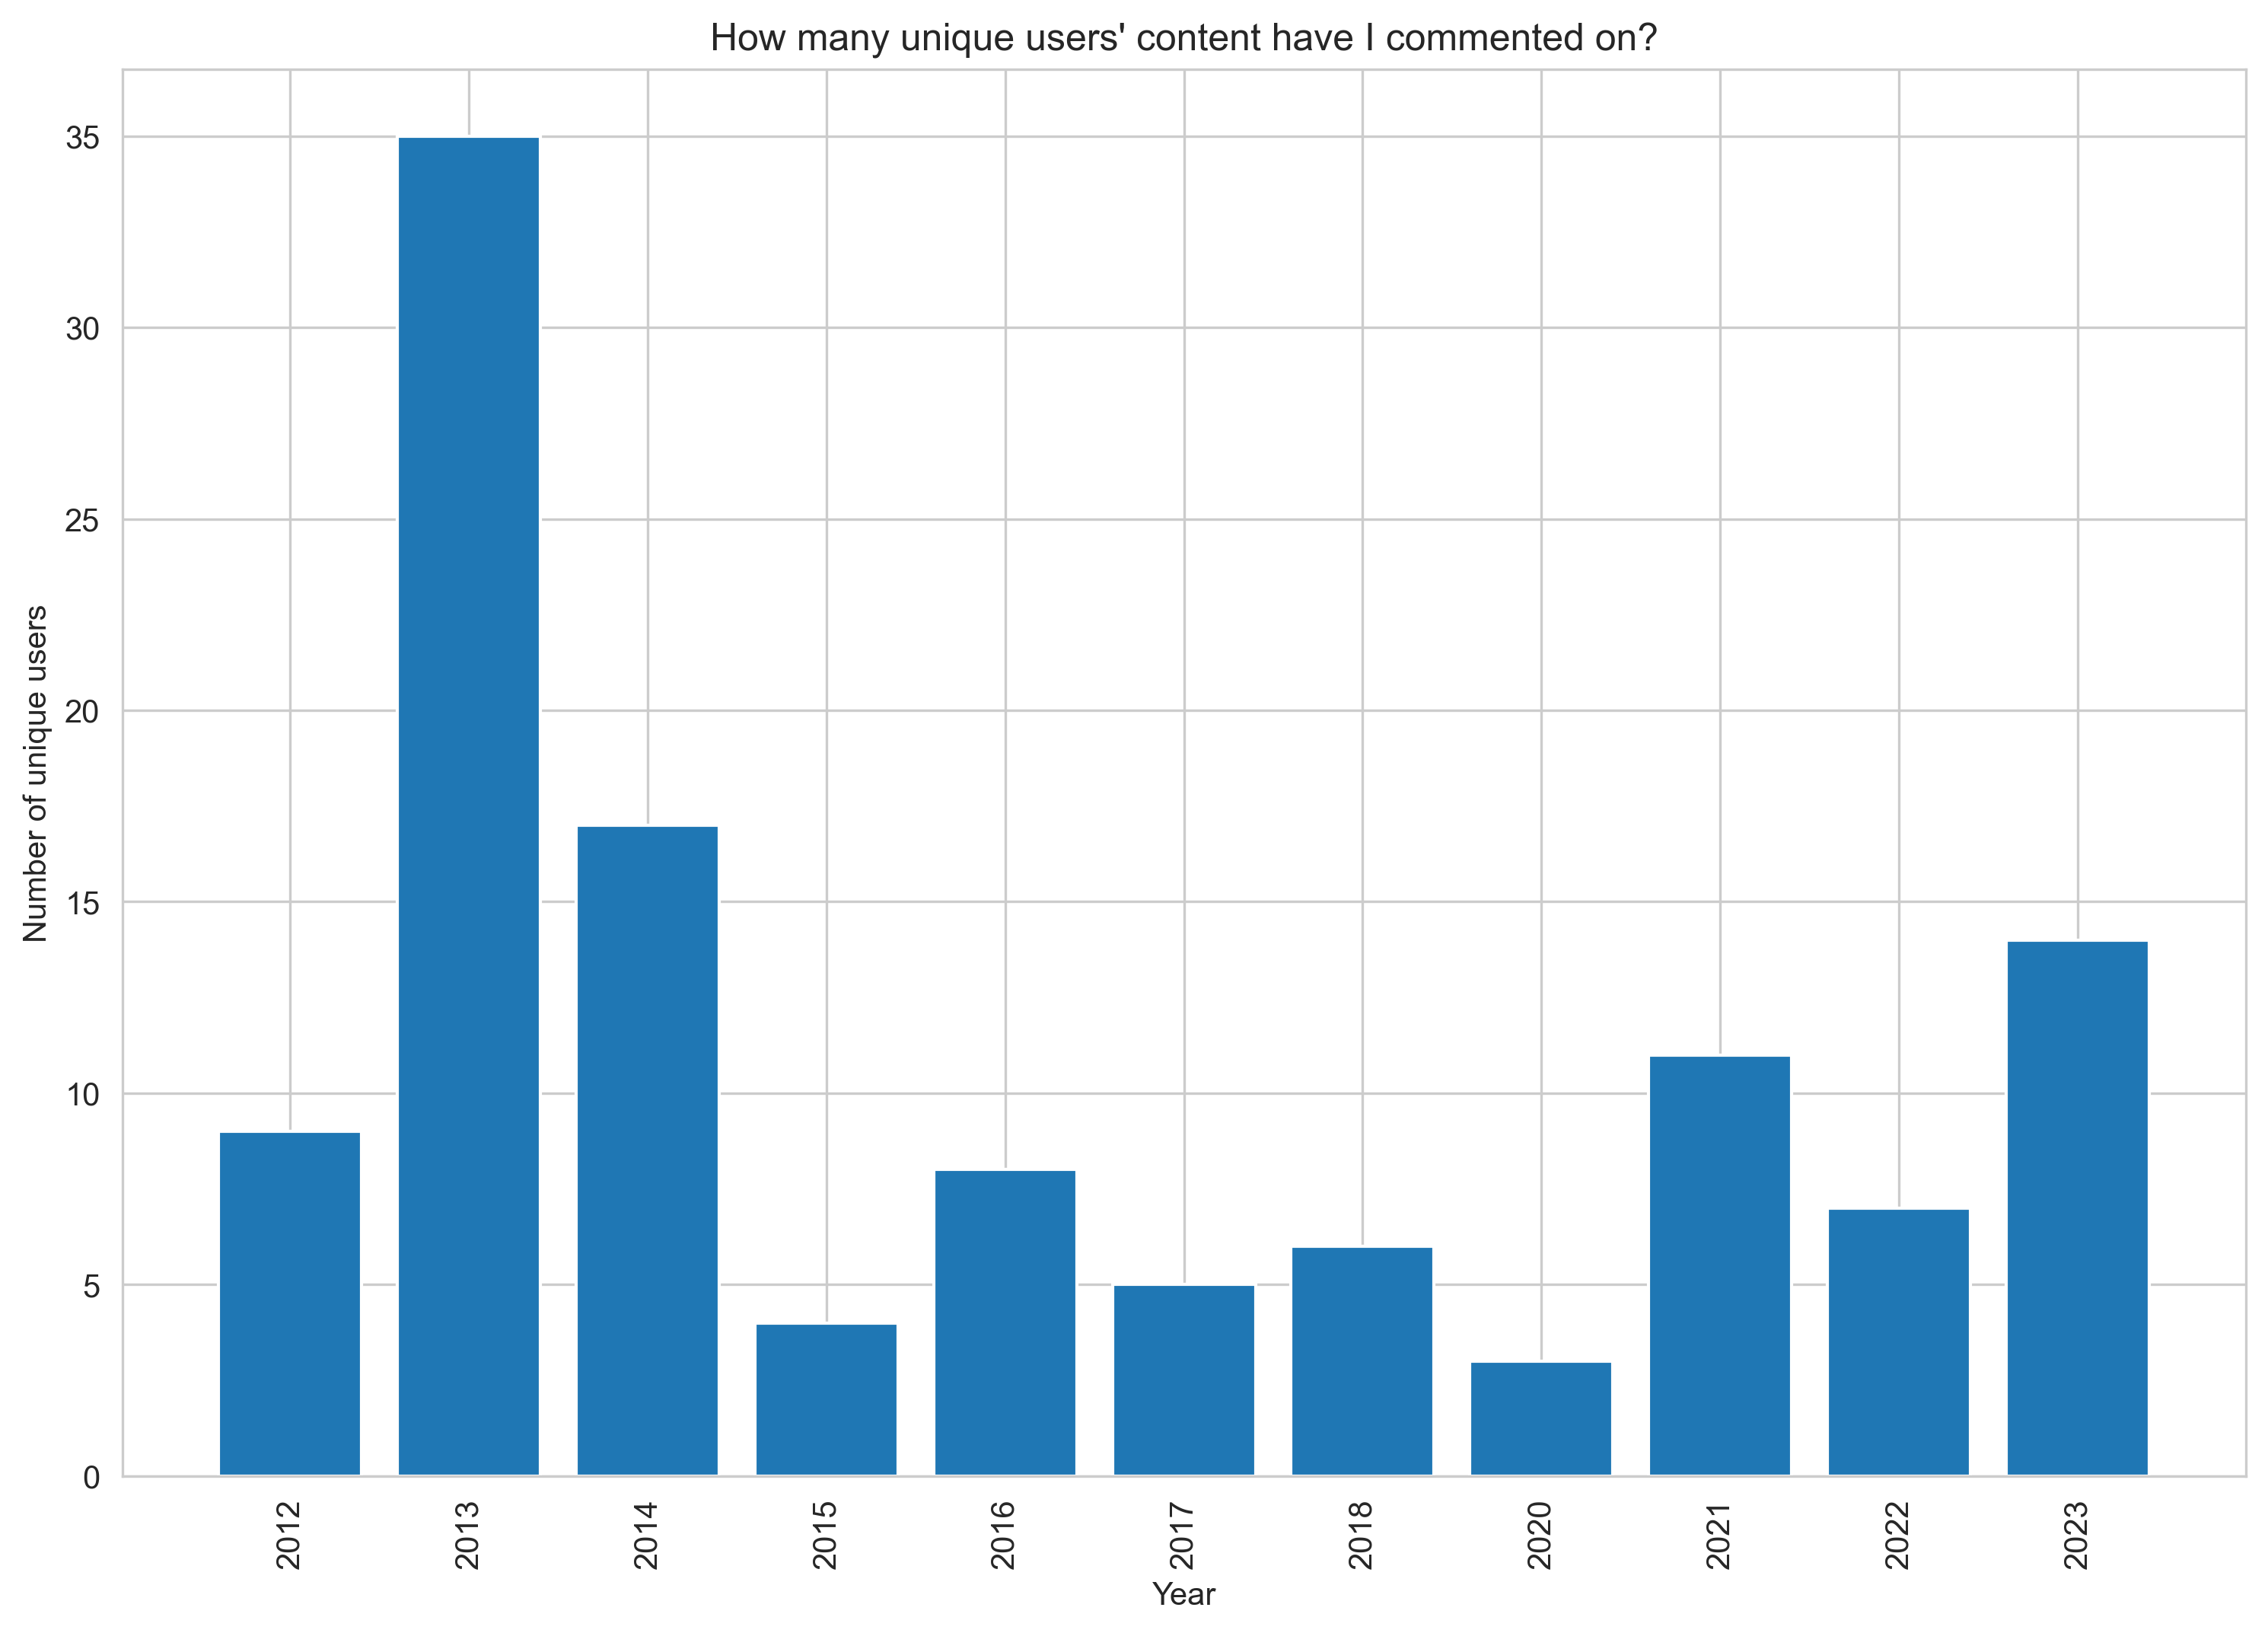
Comments
Similarly, it seems I comment on other people’s posts toward the end of each episode of life.
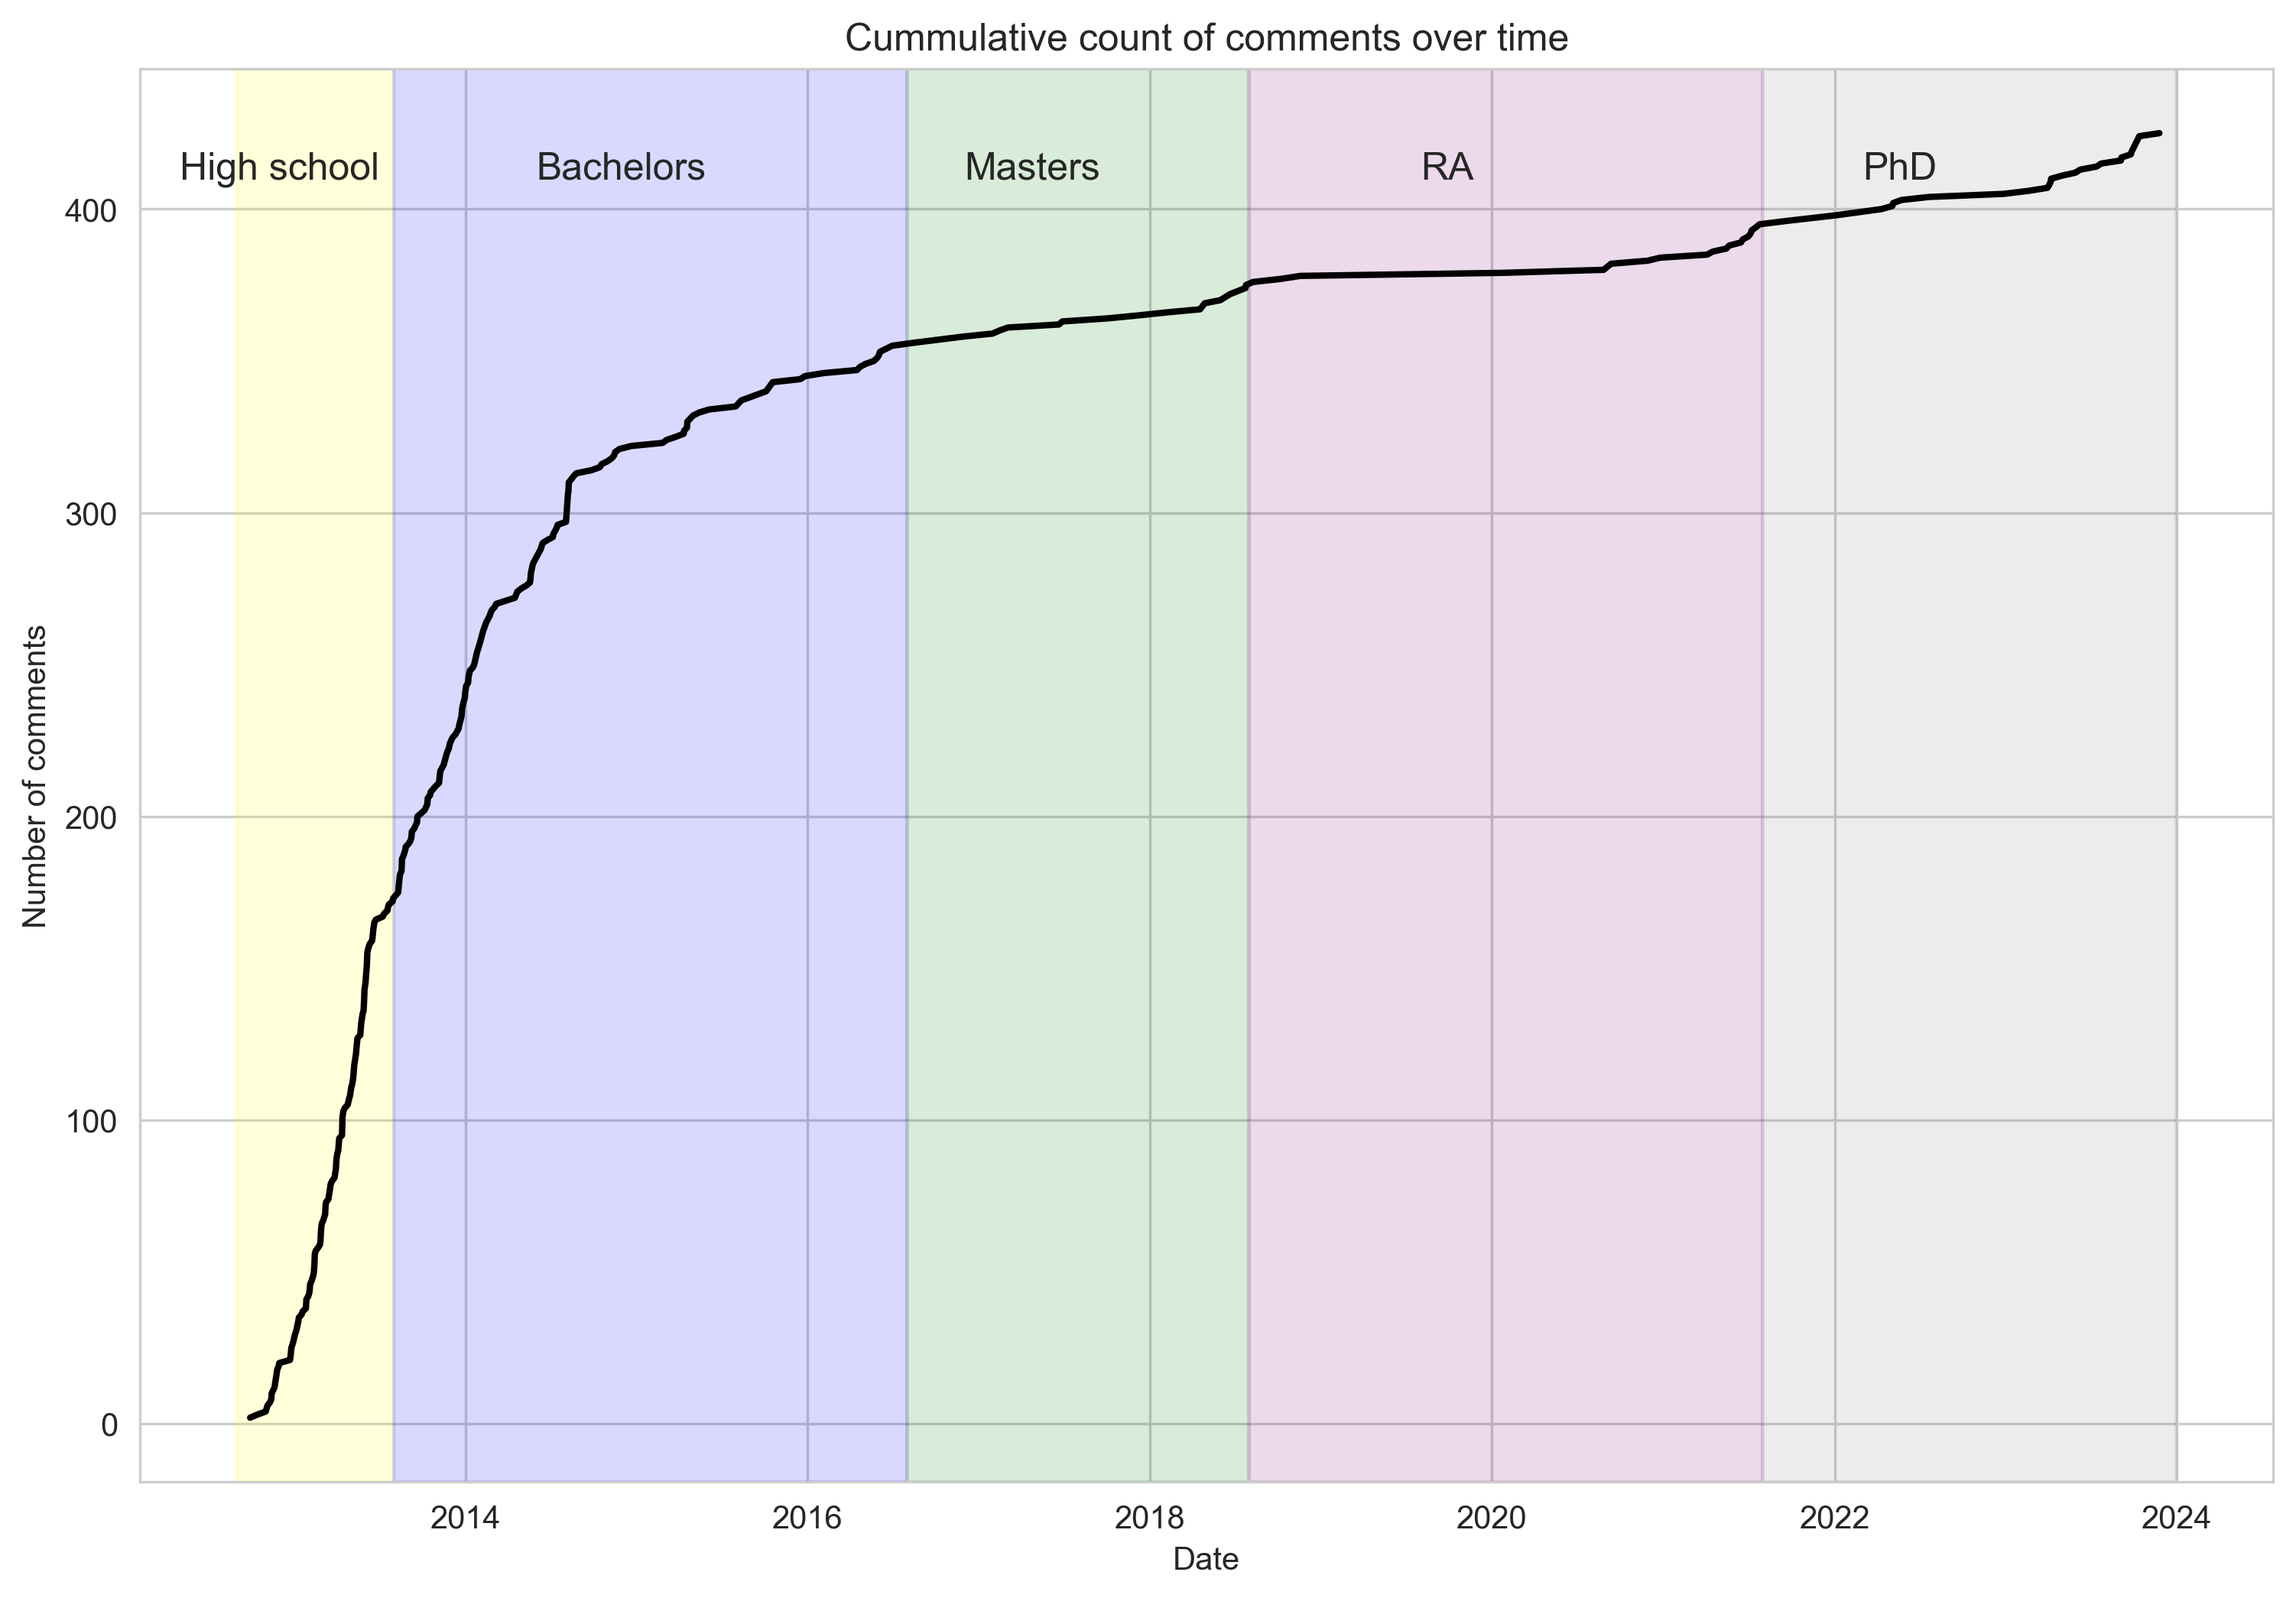
We could also see that the number of unique people on whose posts I comment increases greatly in the first year at uni (2013), first year of the masters (2016), first year of the PhD (2021) and my semester abroad (2023).
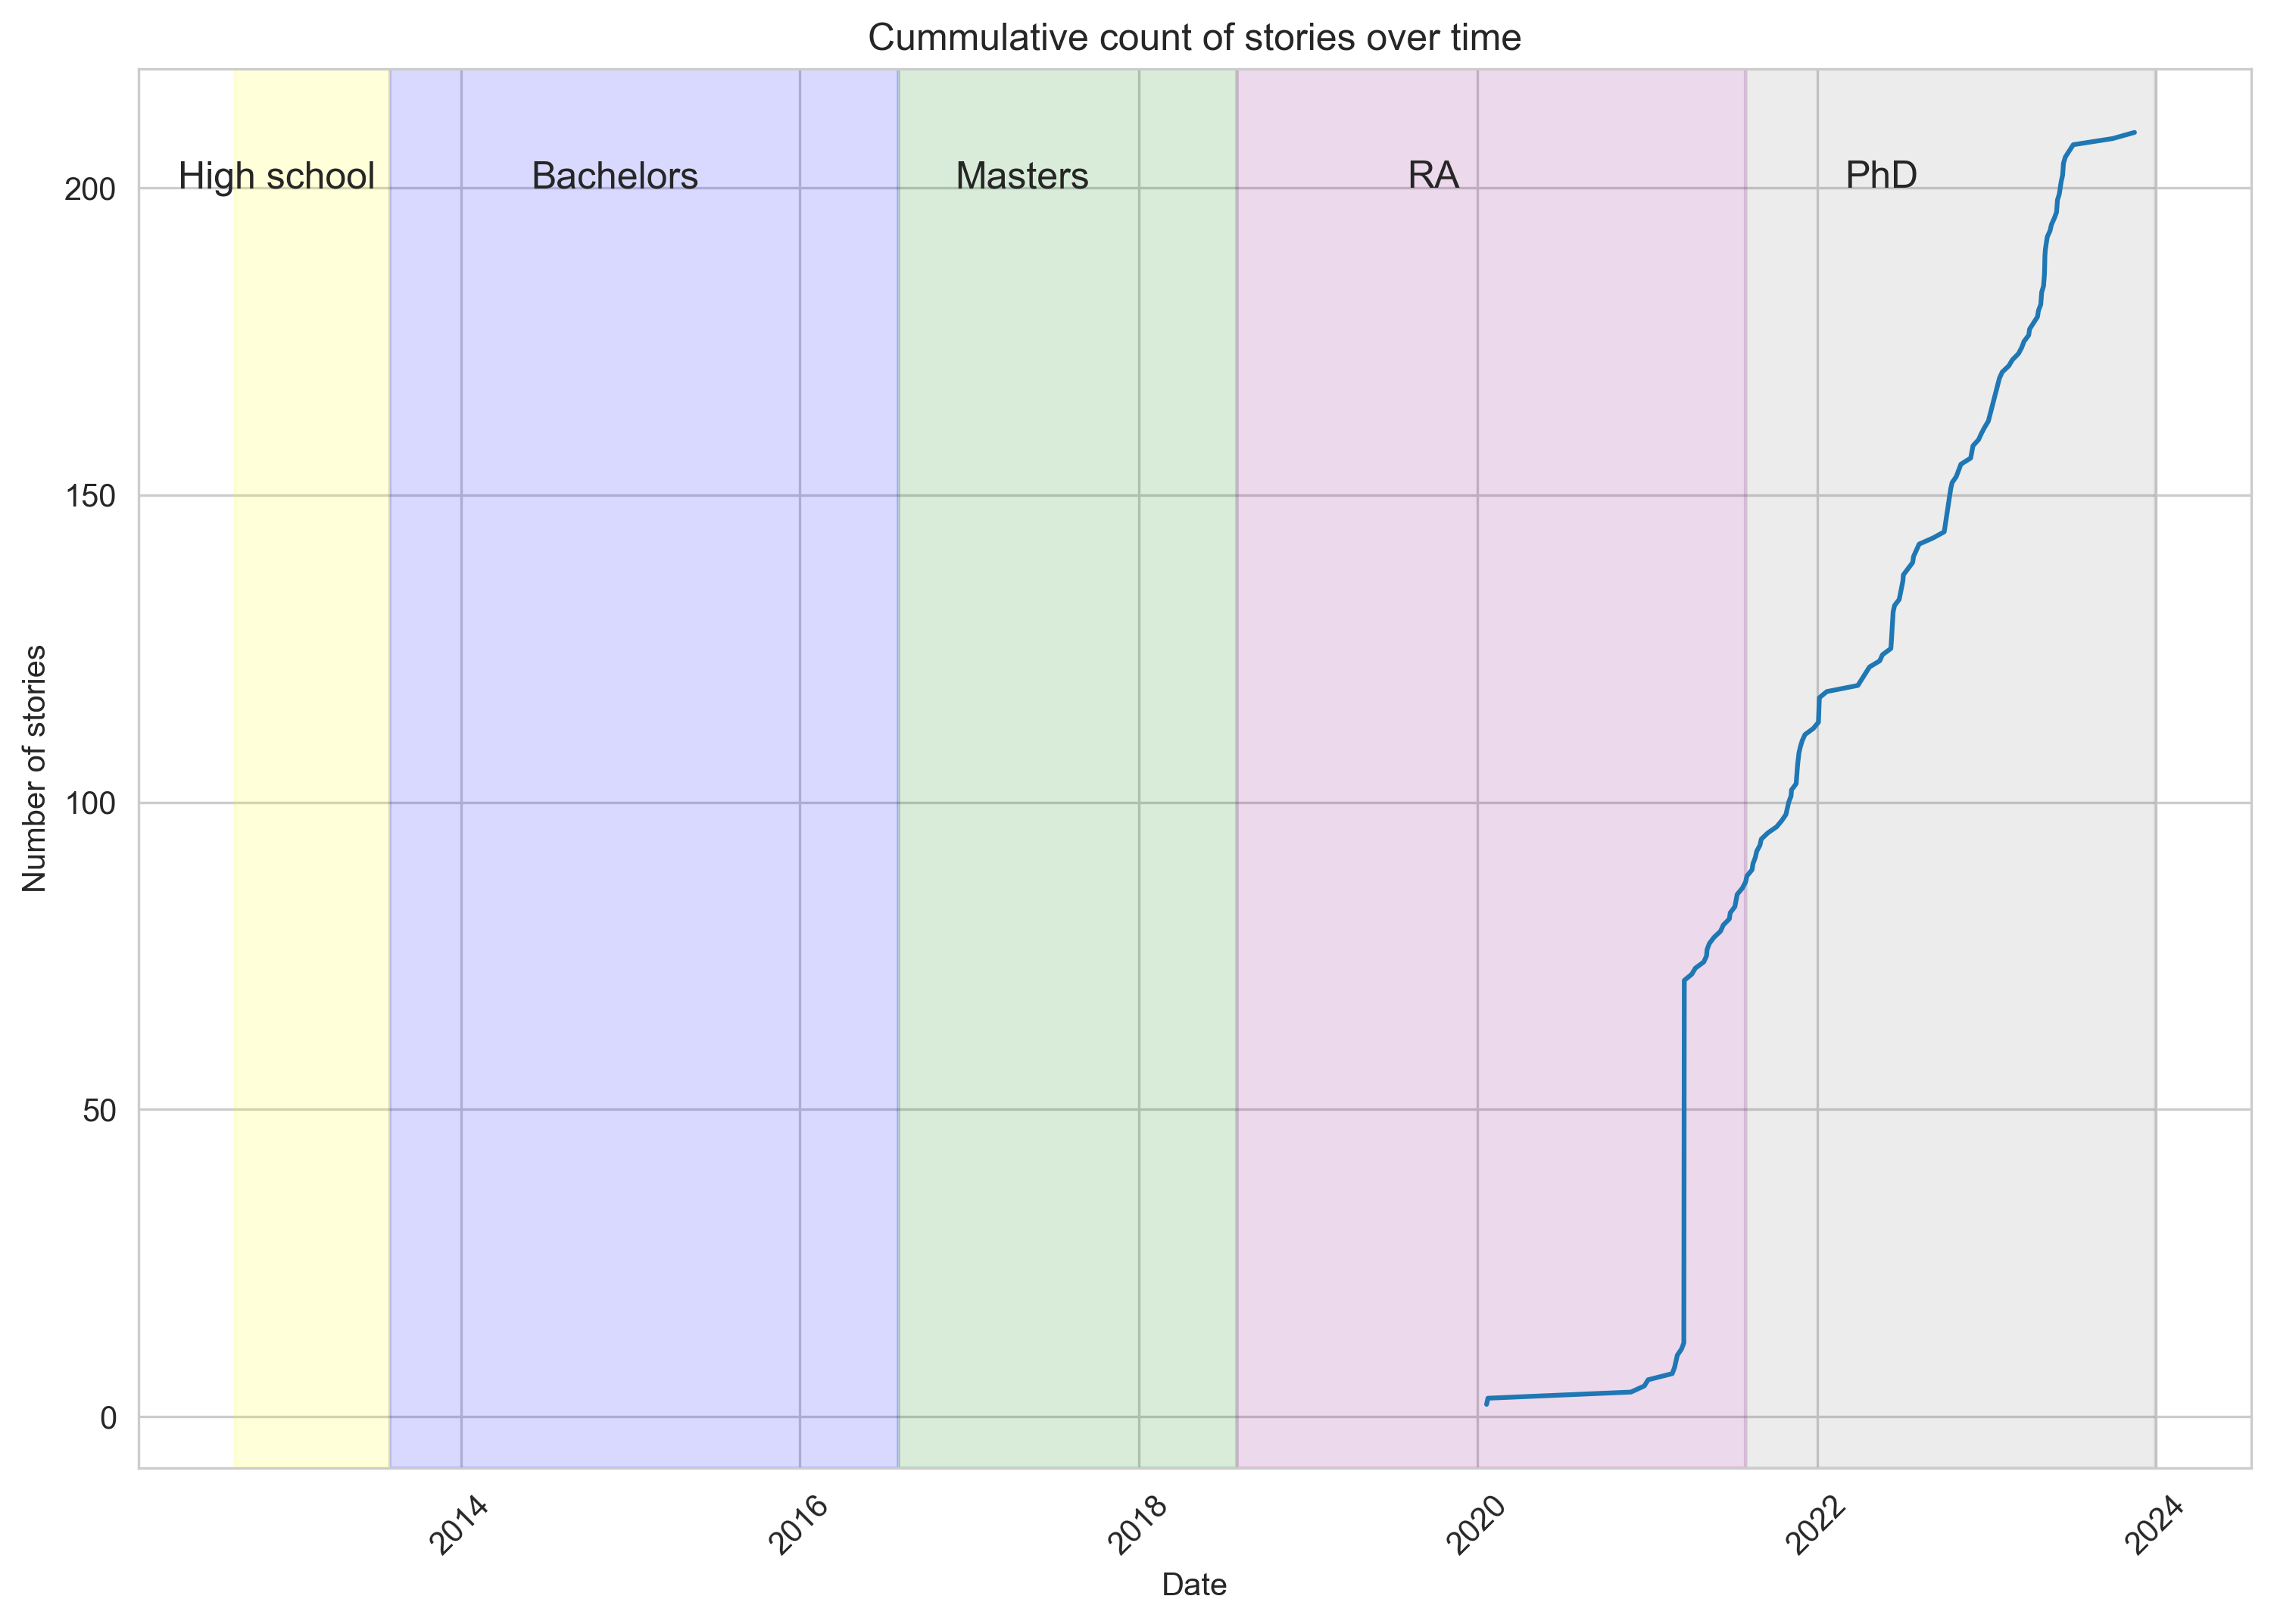
Posting content
Instagram “Stories” was added as a feature in August 2016. I resisted the temptation to use Stories for quite a few years, even after it took off amongst folks. Stories was just a fake Snapchat. Oh how times change. In any case, I “imported” some of my stories from Snapchat into a highlight reel on Instagram, so it looks like I had over 50 stories in just a day or two. Otherwise, I have approximately 50 stories per year.
Funny enough, most of these stories are about random beautifully unnecessary statistics like this one!
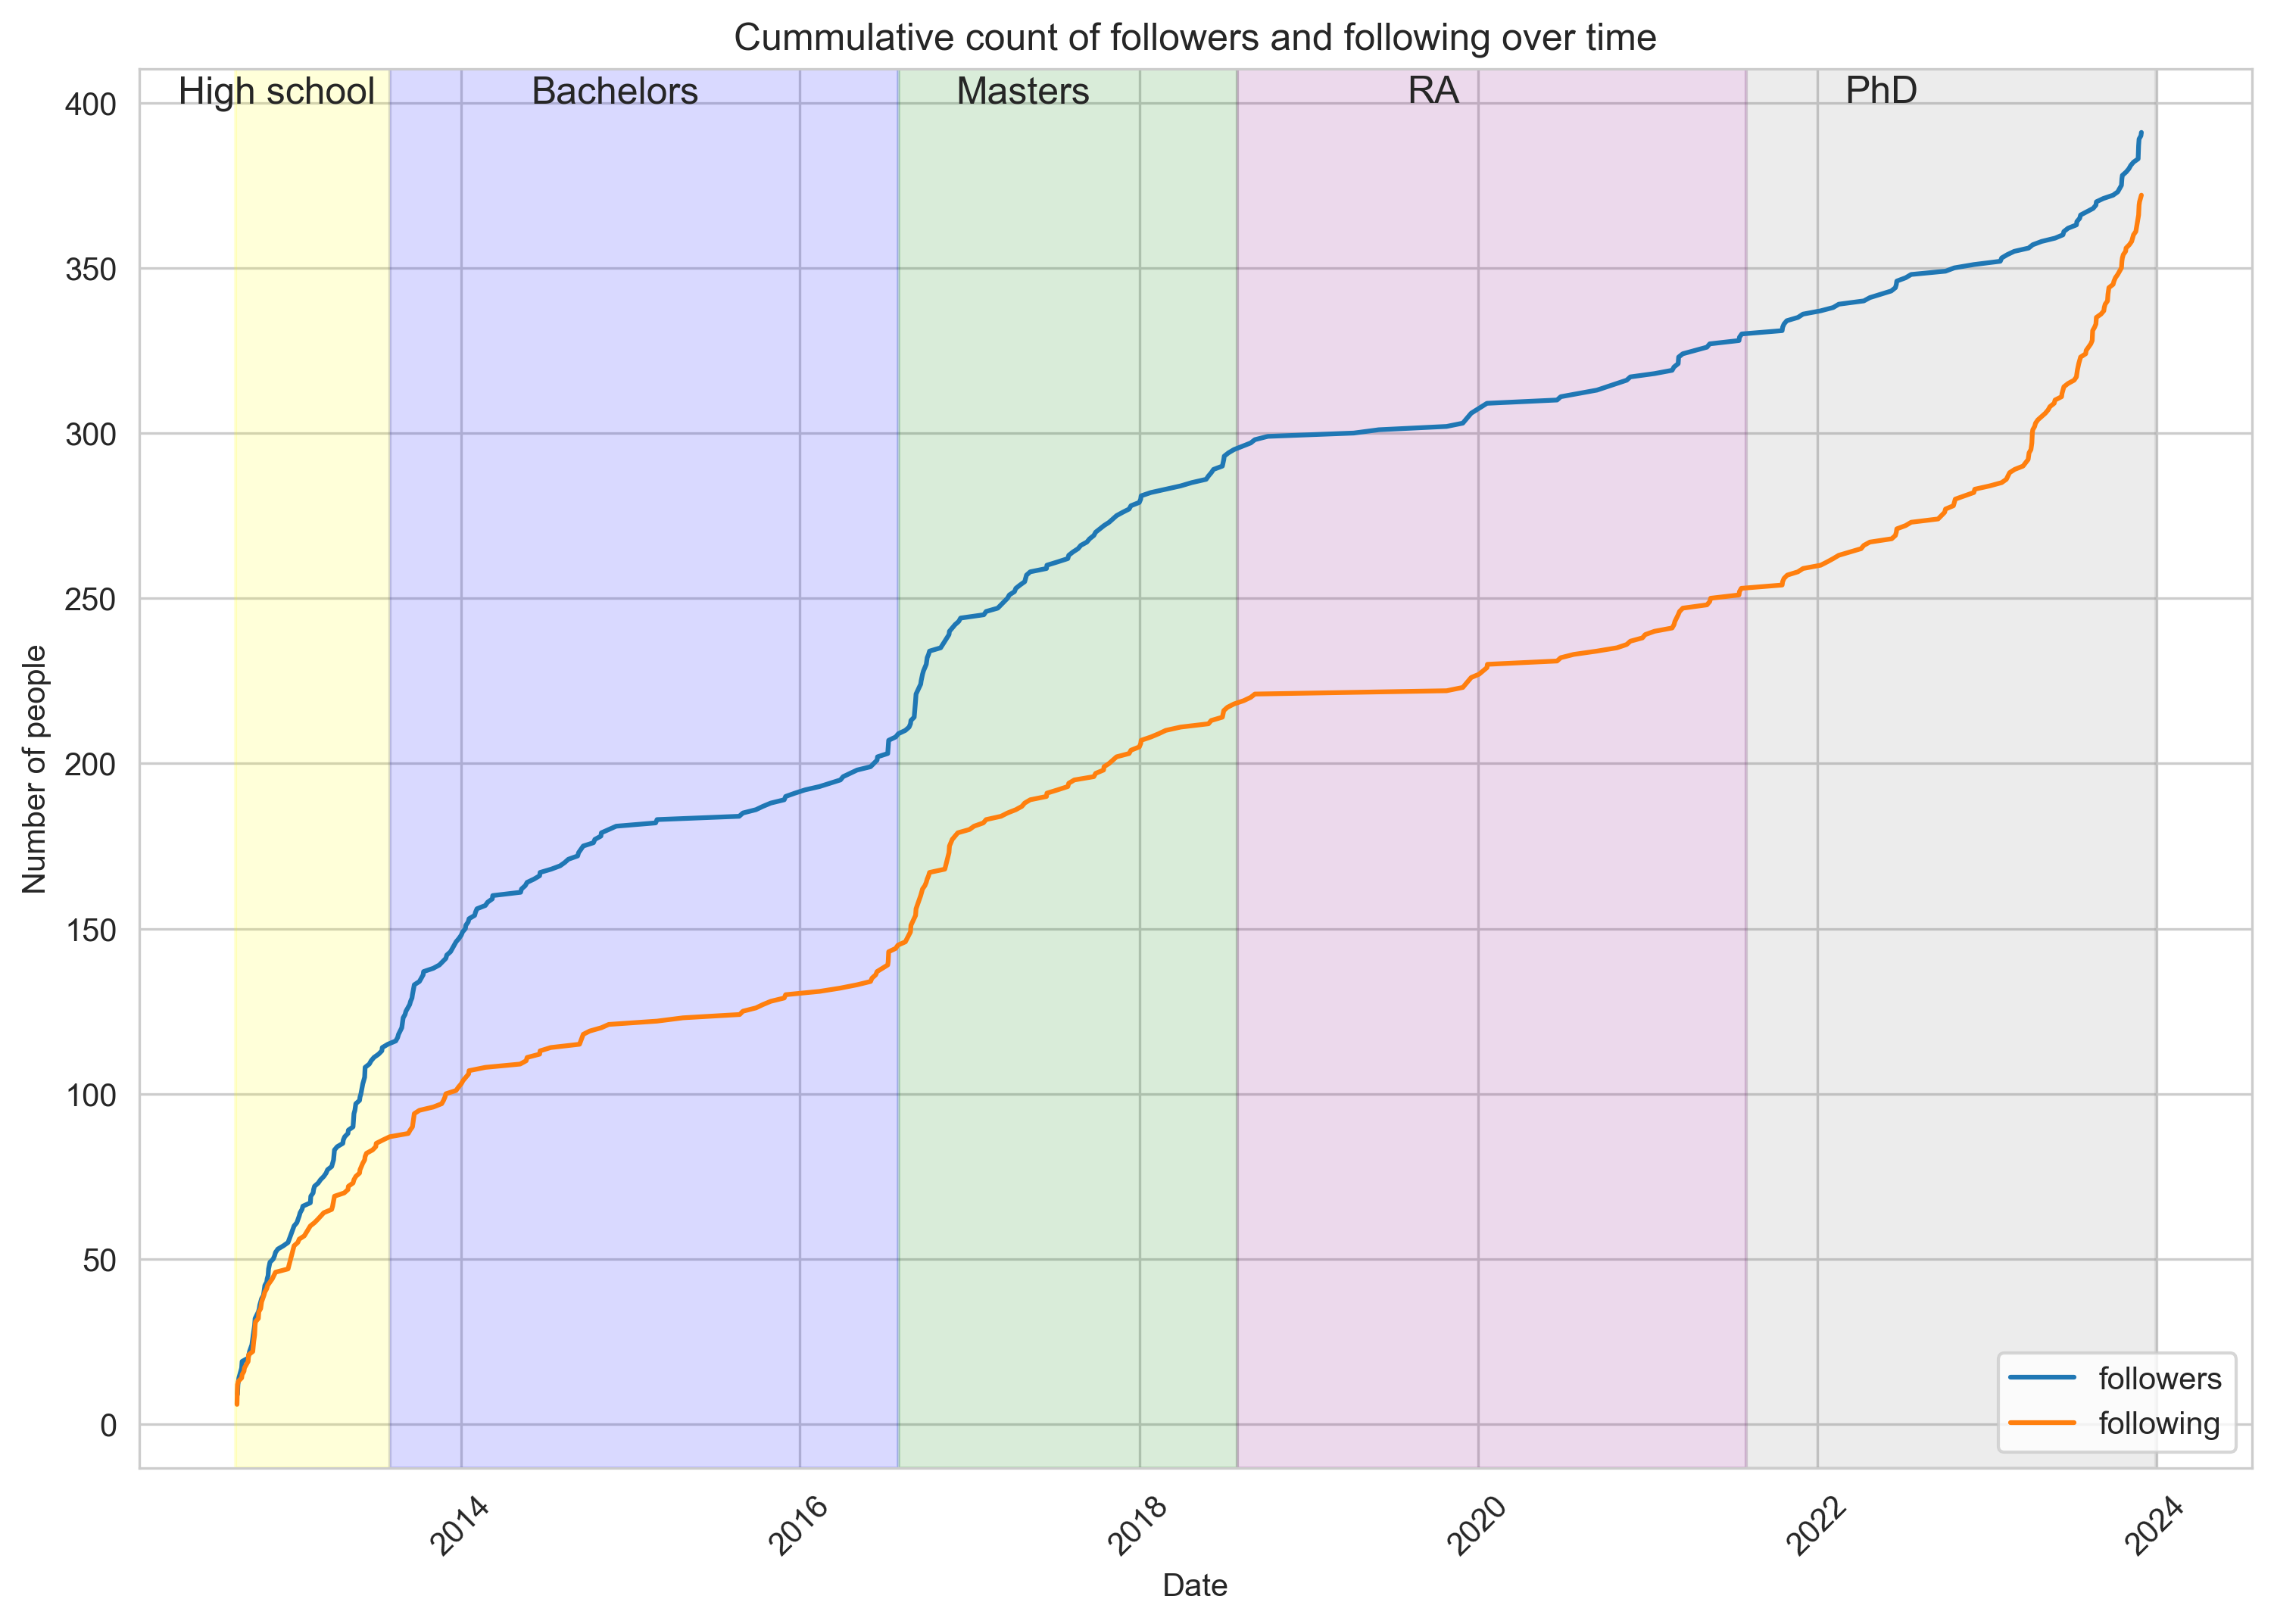
Followers and following
This doesn’t have as clear trends, but it seems like I do follow new people shortly after starting a new episode of life. This is especially prominent when starting the masters (perhaps, the last bigger cohort I’ve joined since then).
One way of interpreting the difference between number of followers and following is that it’s a measure of… pretentiousness.
This is in the sense that I allow myself to be followed by someone whom I do not care to follow back.
Luckily, it seems that I was least pretentious in high school and right now (unless there’s some purely mechanical reason for these convergings that I’m missing now).
So, I do interact with more people and more often on social media around my entering or leaving a new academic chapter in life. How is anyone any better off for having gotten this piece of information? We’re not. This has been, as always, beautifully unnecessary statistics!
Uploaded 2024–04–19; Last updated 2024–04–19